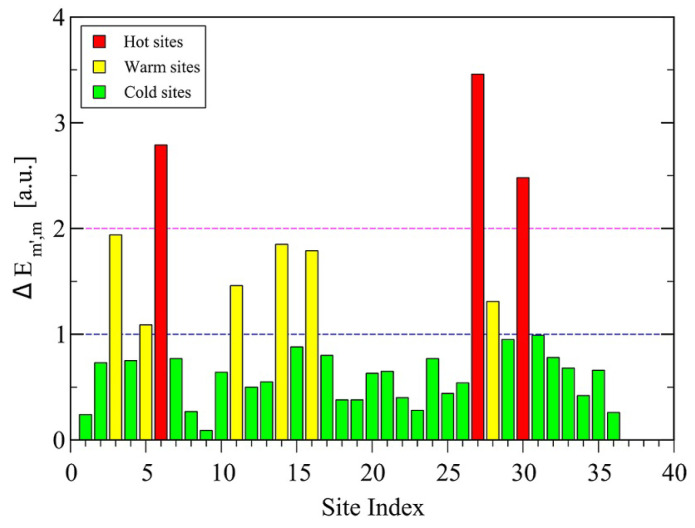
Figure 40.
Local energy variations for single mutations at a site i in the native structure of as a function of site index i. The colors indicate sites belonging to the same subset, denoted here as hot sites (6,27,30) (red bars) with , warm sites (3,5,11,14,16,28) (yellow bars) with , and cold sites (1,2,4,7,8,9,10…) (green bars) with .

