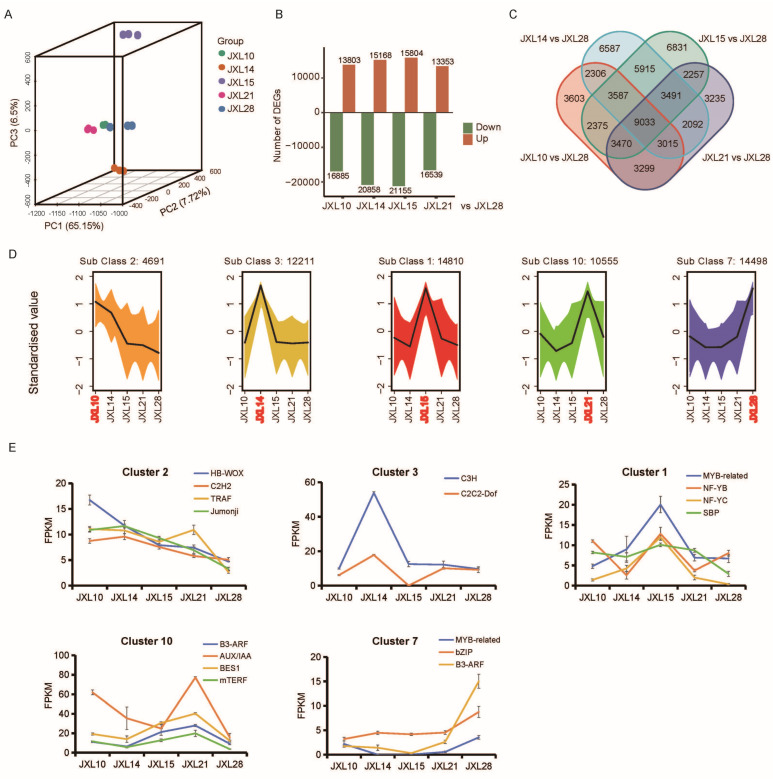
Figure 4.
Transcriptome analysis of five representative A. roxburghii cultivars. (A) Results of 3D-PCA of five “Jinxianlian” cultivars based on the expression level of all unigenes, with each dot representing an independent experimental repeat. (B) Numbers of up- and down-regulated DEGs in each comparison (others vs. JXL28). (C) Venn diagram showing the number of DEGs in each combination. (D) Results of five main clusters from K-means clustering analysis. (E) RNA-seq results for several transcription factor candidate from five main clusters.

