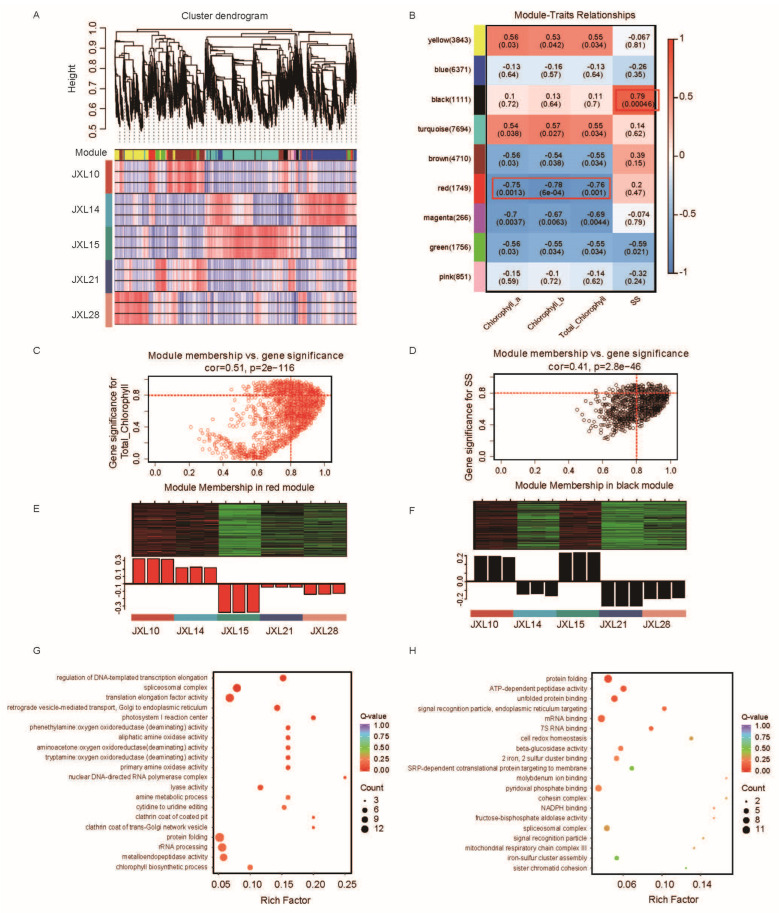
Figure 5.
Identification of important modules and biomarkers based on a WGCNA. (A) A cluster dendrogram and the color display of co-expression network modules for all unigenes. (B) A correlation matrix of the module eigengene values obtained from the WGCNA. Nine modules were identified, and each module eigengene was tested for correlation with traits. In each cell, the upper values are the correlation coefficients between the module eigengenes and the traits; the lower values are the corresponding p-values; the co-expression modules significantly associated with the content of Chl a, Chl b, and total chlorophyll content and sucrose synthase activity are highlighted in red boxes. (C,D) A scatterplot describing the relationship between MM and GS in the red (C) and black (D) modules; key genes are screened out in the upper-right area, where GS > 0.8 and MM > 0.8. (E,F) A heatmap of the genes in the red (E) and black (F) modules; (G,H) A dotplot of the GO enrichment analysis of the genes in the red (G) and black (H) modules.

