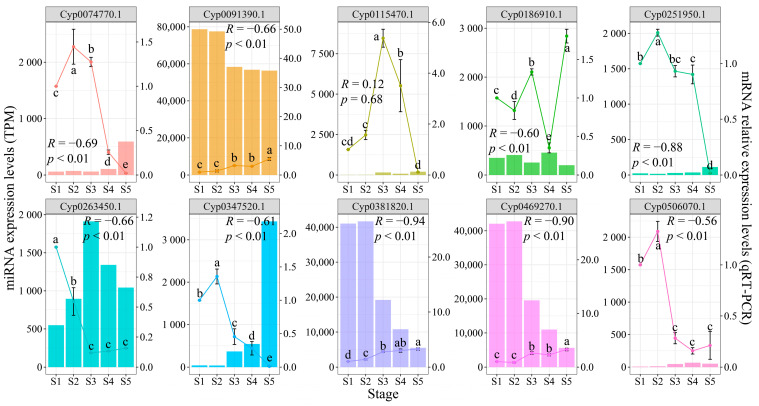
Figure 6.
Expression analysis between target genes and their corresponding miRNA. The line plots represent the relative expression levels of mRNAs, with data shown as means ± standard deviation from three independent experiments. Different lowercase letters indicate significant differences (p < 0.05, Duncan’s multiple range tests). The bar charts show miRNA expression levels, and the correlations between mRNAs and miRNAs were analyzed using Pearson’s correlation coefficient (p < 0.05 indicates significant correlation and p < 0.01 indicates highly significant correlation). For target genes regulated by multiple miRNAs, only the correlation with the lowest p value is shown in the figure.

