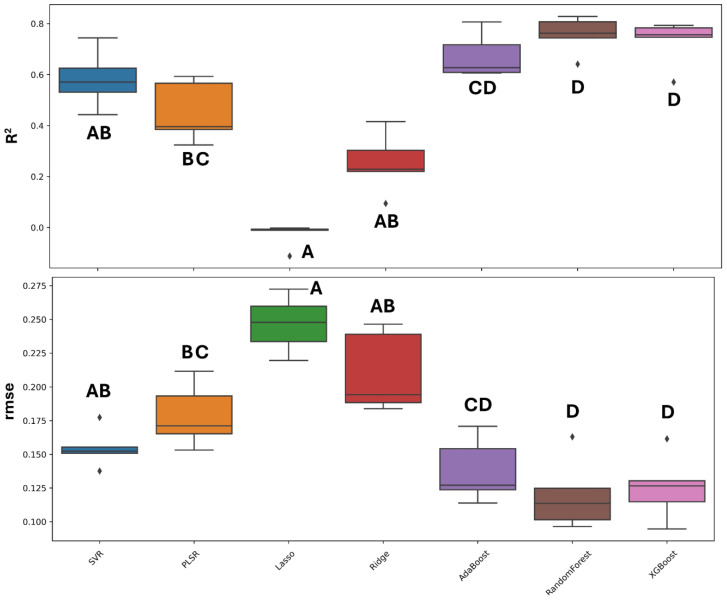
Figure 3.
Boxplots showing the distribution of performance parameters for the testing sets from five random splits (total: n = 144) of the machine learning models used in this study. The black line within the box represents the median. Different letters denote statistically significant differences among the models at p < 0.05, as determined by Tukey’s test.

