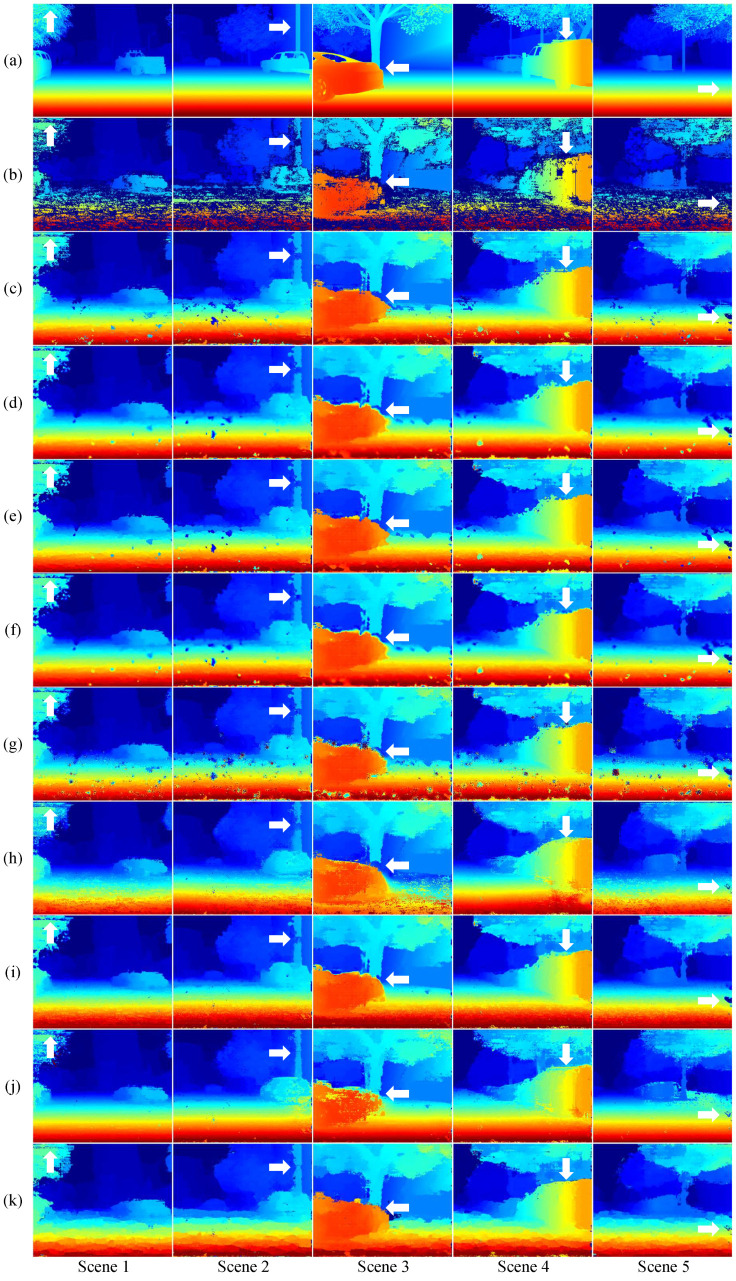
Figure 7.
Disparity map comparisons on the synthetic Driving dataset across different scenes. (a) Ground truth, (b) SGM, (c) SGM, (d) Linear Interpolation, (e) Nearest Interpolation, (f) PDE, (g) ShCNN [56], (h) GMCNN [55], (i) MADF [58], (j) Chen [57], and (k) The proposed. Invalid regions are shown in darkish blue.

