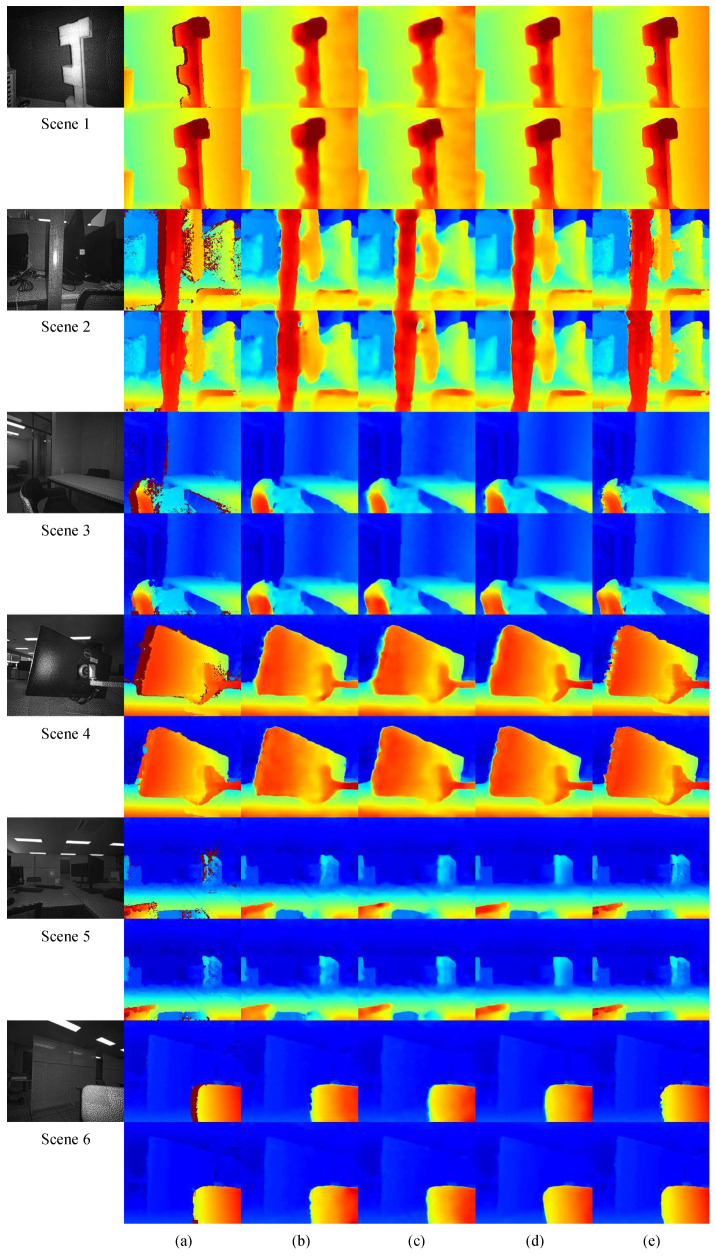
Figure 13.
Disparity map comparisons across various scenes using different models. (a) GT, (b) CNN-based, (c) ResNet-based, (d) ViT-based, (e) PSMNet [50]. The first row of each scene is trained with the original SGM GT, and the second row with the proposed GT. Invalid regions are shown in darkish red.

