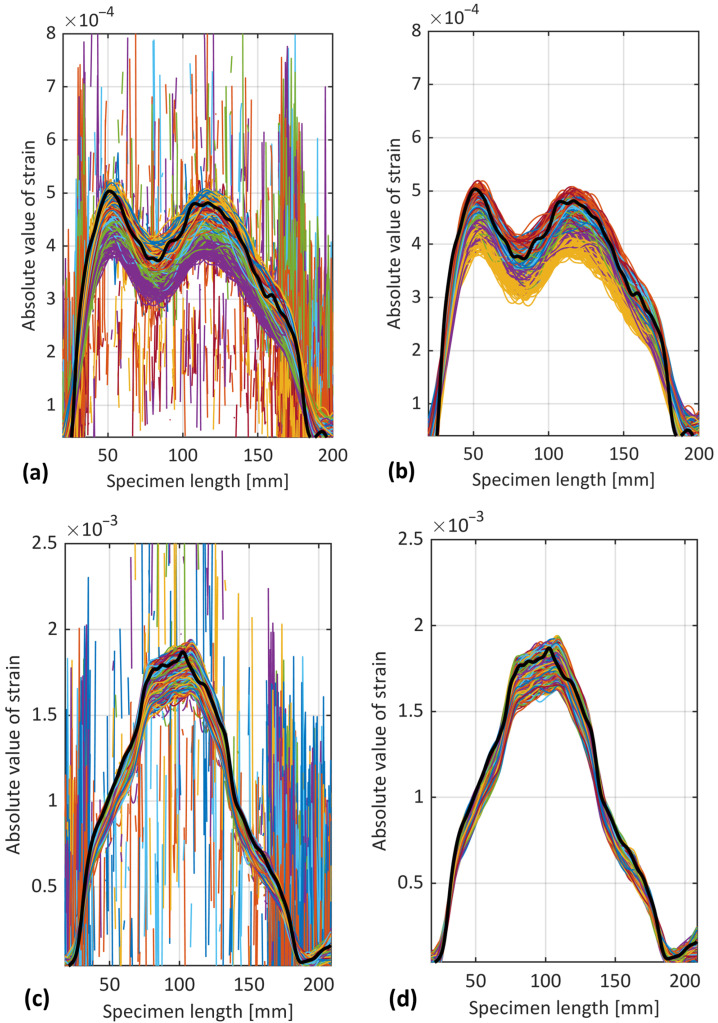
Figure 9.
(a) Raw and (b) filtered strain signals of OBR before crack propagation (from 40,000 to 60,000 cycles). (c) Raw and (d) filtered strain signals after crack propagation (from 134,320 to 136,320 cycles) for sample S2. Black signal shows the static acquisition, and colorful signals correspond to dynamic acquisition.

