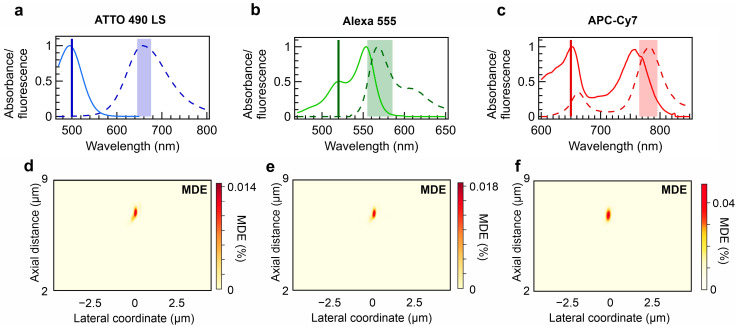
Figure 4.
Molecule detection efficiency under epi-fluorescence configuration. Absorbance and fluorescence spectra of (a) ATTO 490 LS, (b) Alexa 555, and (c) APC-Cy7. The spectral data are adopted from [40]. The solid line spectra denote absorbance, whereas the dashed line spectra refer to emission. In addition, the solid lines denote the design excitation wavelength, and the shading indicates the simulated collection band by the metalens. The spectra-computed molecule detection efficiency with dual-wavelength metalenses designed for (d) ATTO 490 LS, (e) Alexa 555, and (f) APC-Cy7.

