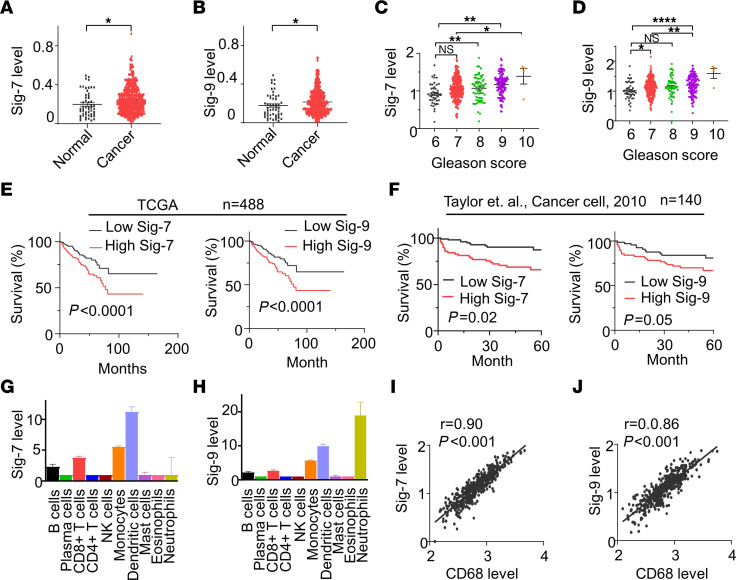
Figure 1. High Siglec-7/9 expression is correlated with worse clinical outcome in patients with PCa.
Violin plots showing that (A) Siglec-7 and (B) Siglec-9 mRNA expression are significantly higher in tumor tissues (n = 497) than normal tissues (n = 53). Data were analyzed by unpaired student’s t test. (C) Siglec-7, and (D) Siglec-9 are correlated with Gleason Score. Data were analyzed by 1-way ANOVA with post hoc Tukey’s test and presented as mean ± SEM. (E) High Siglec-7 and Siglec-9 expression is correlated with worse survival in patients with PCa in the TCGA-PRAD database (n = 488). (F) High Siglec-7 and Siglec-9 expression are correlated with worse survival in patients with PCa in MSKCC database (n = 140). Survival analysis was conducted using the Kaplan–Meier (log-rank test). Median expression was used as cutoff between high and low Siglec-7 and -9 expressing groups. (G) Siglec-7, and (H) Siglec-9 are highly expressed in monocyte, dendritic cells, and CD8+ T cells identified by CIBERSORTx from the TCGA-PRAD database. (I and J) Scatter plot of RNA expression of (I) Siglec-7 and (J) Siglec-9 compared with CD68 in prostate tumor tissues (n = 494), according to TCGA data. Siglec-7, and Siglec-9 are correlated with macrophage marker CD68. Data were analyzed by Pearson’s correlation. *P ≤ 0.05; **P ≤ 0.01; ***P ≤ 0.0001.

