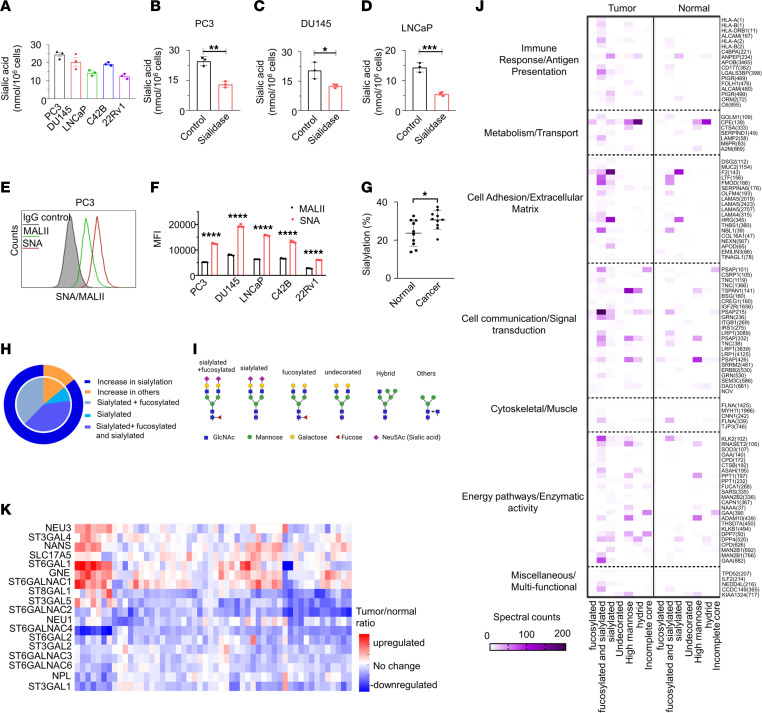
Figure 3. Sialic acid is expressed on the surface of PCa cells.
(A) surface sialic acid is detected in tested PCa cell lines. Sialidase treatment reduces the surface sialic acid levels in (B) PC3, (C) DU145, (D) LNCaP. (E) The expression levels of α2,6-linked and α2,3-linked sialic acids in PC3 cells were analyzed by flow cytometry using Sambucus nigra agglutinin (SNA) and Maackia amurensis agglutinin II (MALII) lectins, respectively. (F) Quantification was assessed using MFI for SNA and MALII staining on PCa cells. (G) Sialylated spectral counts versus total spectral counts of PCa tumor tissues and adjacent normal tissues by mass spectrometry. (H) Summary of glycosylation changes by glycosite in PCa compared with normal prostate samples. (I) Schematics of glycan structures. The schematic diagram was created with Biorender.com. (J) GO term pathway analysis of sialylated proteins in PCa tumor tissues and adjacent normal tissues by mass spectrometry show enrichment in immune response/antigen presentation pathways. Protein names displayed on the right side with the glycosites in parentheses. (K) Analysis of transcript data from TCGA-PRAD database of sialyglycan gene expression demonstrates 7 significantly upregulated genes and 12 downregulated genes in cancer samples compared with noncancerous prostate tissues. Data were analyzed by unpaired Student’s t test and presented as mean ± SEM. *P ≤ 0.05; **P ≤ 0.01; ***P ≤ 0.001; ***P ≤ 0.0001.

