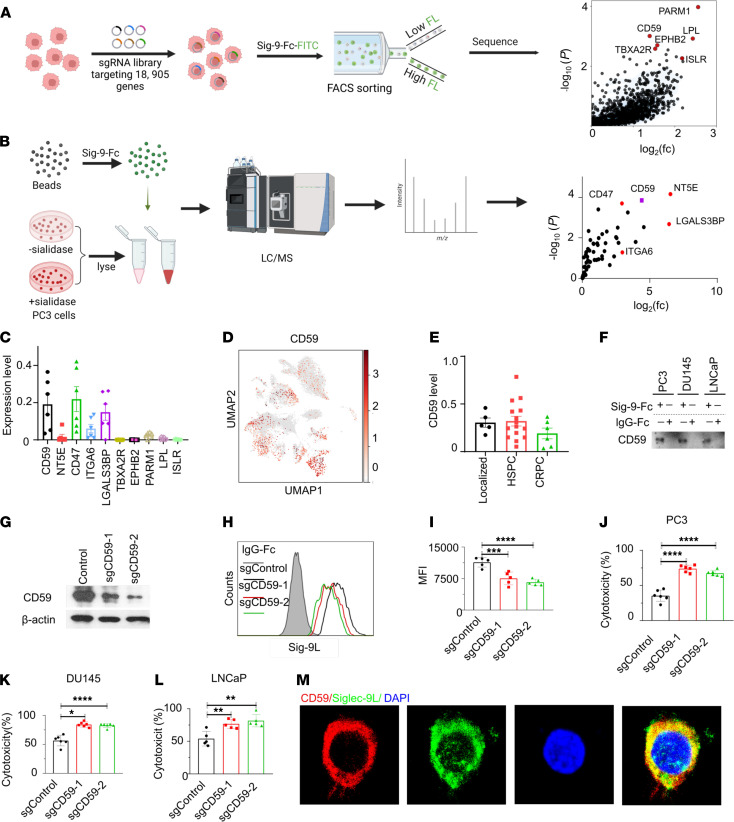
Figure 6. CD59 is a Siglec-9 ligand in PCa.
(A) Experimental setup and CRISPRi screen results for identifying Siglec-9 ligands using CRISPR screen. PC3 cells expressing dCas9 were infected with a genome-wide CRISPRi-v2 library, and cells with reduced binding to recombinant Siglec-9 Fc proteins were sorted for deep sequencing (n = 3). The schematic diagram was created with Biorender.com. (B) Identification of sialic acid–dependent Siglec-9 ligands through LC-MS/MS pull down analysis by Siglec-9 Fc chimera protein (n = 3). The schematic diagram was created with Biorender.com. (C) Analysis of transcript levels of Siglec-9 ligands by sc-RNA sequencing. CD59 and candidate ligands identified by CRISPRi and MS expressed in metastatic epithelial cells from patients with CRPC. (D) UMAP profile shows the distribution of CD59 in different cell types in human metastatic CRPC tumor tissues, refer to Figure 2A for cell type distribution. (E) CD59 is expressed in cancer epithelial cells from patients with localized, HSPC, and CRPC. (F) Western blotting validation of CD59 as a Siglec-9 ligand using recombinant Siglec-9 Fc protein blotting pull-down blotting. (G) Western blot analysis of CD59-KO PC3 cells using the CRISPR/Cas9 system. (H) Flow cytometry analysis and (I) corresponding quantification demonstrating reduced binding capacity of Siglec-9 Fc in CD59 knockout PC3 cells compared with control cells. Gray, IgG Fc; black, control cells; red, sgCD59-T1; green, sgCD59-T2. (J) Enhanced cytotoxicity of CD8+ T cells were observed in CD59-KO PC3 cells, (K) DU145 cells, and (L) LNCaP cells. (M) Confocal microscopy showing substantial colocalization between Siglec-9 ligands and CD59 on PC3 cells. Data were analyzed by 1-way ANOVA with post hoc Tukey’s test and presented as mean ± SEM.*P ≤ 0.05; **P ≤ 0.01; ***P ≤ 0.001; ***P ≤ 0.0001.

