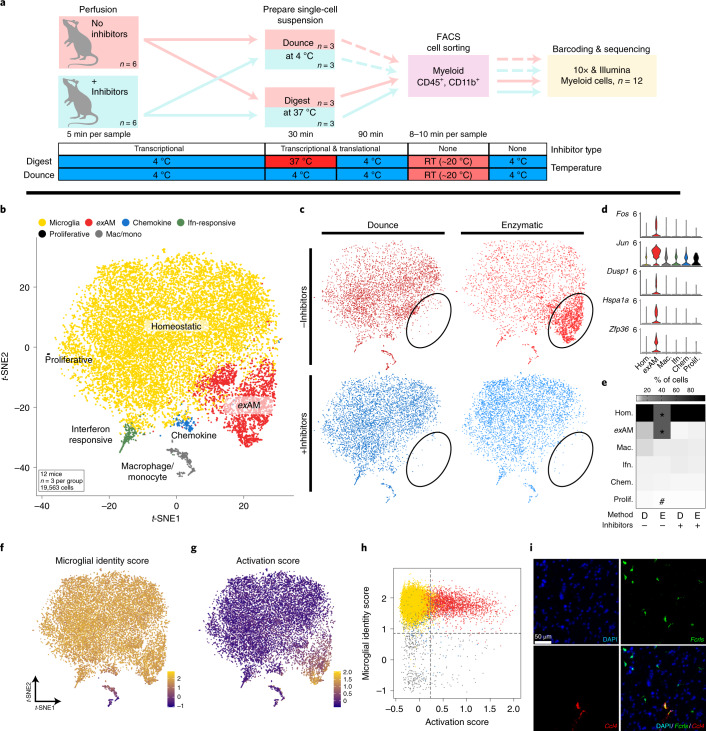
Fig. 1. Analysis of sorted microglia confirms profound effect of enzymatic digestion on microglial gene expression via scRNA-seq.
a, Experimental design schematic for sorted mouse myeloid cells scRNA-seq experiment (Methods and Supplementary Fig. 1a–c). b, t-SNE plot for the 19,563 cells from n = 12 mice (n = 3 per group) colored and annotated by cluster (Supplementary Fig. 2). c, t-SNE plot split by experimental subgroup highlights enrichment of exAM cluster (circled) in ENZ-NONE group. d, Gene expression of several exAM cluster markers across each cluster. e, Heatmap of the mean percentage of cells in each cluster across conditions (*FDR < 0.005 for ENZ-NONE versus all other groups; #FDR < 0.05 DNC-NONE versus ENZ-INHIB; Benjamin and Hochberg correction for multiple comparisons; (Supplementary Table 3); Methods: differential abundance testing). f,g, Visualization of gene module scoring results plotted on t-SNE coordinates. f, Microglial identity score (Methods and Supplementary Table 4). g, Activation score based on consensus DEGs from ‘Metacell’ pseudobulk analysis (Methods and Supplementary Tables 4 and 5). h, Plot of microglial identity score versus activation score colored by cluster annotation from panel b. i, smFISH using RNAscope for microglial marker Fcrls (green), cluster marker Ccl4 and counterstained with DAPI; representative images from n = 2 independent experiments. Scale bar, 50 μm. Chem, Chemokine; hom, Homeostatic; mac, macrophage; mono, monocyte; prolif, proliferative.

