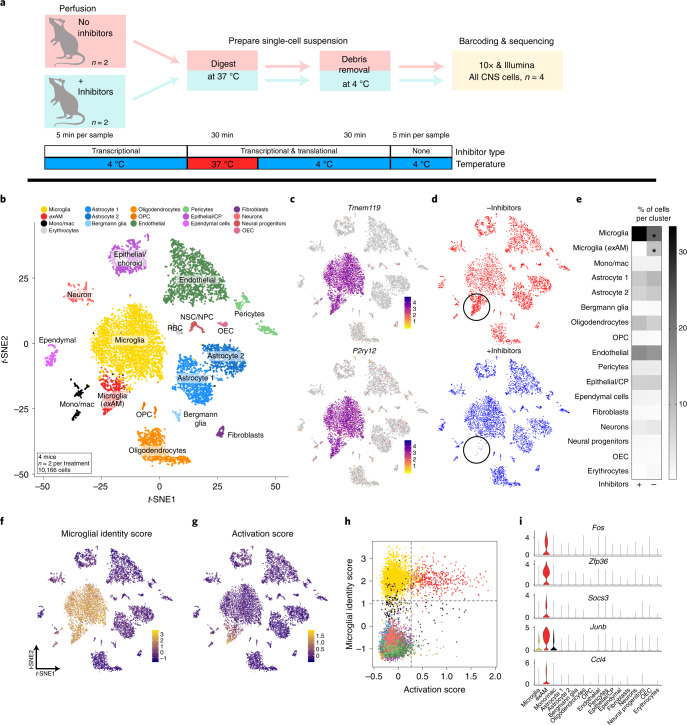
Fig. 2. Enzymatic dissociation induces cell-type-specific artifactual gene expression in mice.
a, Experimental design schematic for scRNA-seq of all CNS cell types (Methods). b, t-SNE plot of 10,166 cells from 4 mice (n = 2 per group), annotated and colored by cell type (Supplementary Fig. 7). c, Expression of microglial-specific genes Tmem119 and P2ry12 clearly defines two microglial clusters. d, t-SNE plot split by experimental group (±inhibitor cocktail) highlights lack of exAM cluster in samples digested with inhibitors present (bottom; circled). e, Heatmap displaying mean percentage of cells in each cluster across conditions (*FDR < 0.0005; Benjamini and Hochberg correction for multiple comparisons; Supplementary Table 18; Methods: differential abundance testing). f,g, Gene module scoring results plotted on t-SNE coordinates. f, Microglial identity score (Methods and Supplementary Table 4). g, Activation score based on DEGs from ‘Metacell’ pseudobulk analysis (Methods and Supplementary Table 4). h, Scatterplot of gene module scores from f and g colored by cluster from panel b. i, Enrichment of genes from activation score in exAM microglia cluster. CP, choroid plexus; NPC, neural progenitor cells; NSC, neural stem cells; OEC, olfactory ensheathing cells; OPC, oligodendrocyte progenitor cells; RBC, red blood cells.

