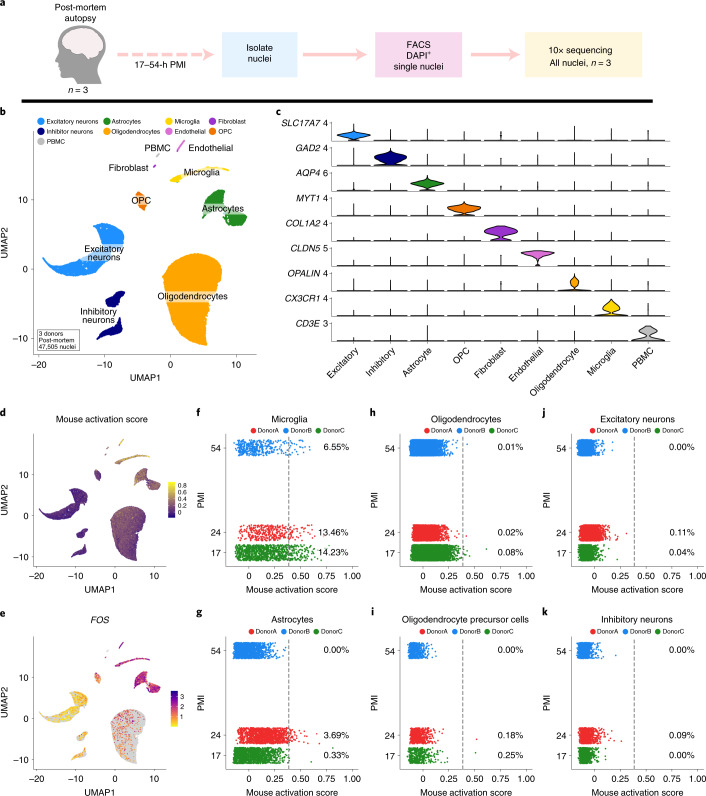
Fig. 3. snRNA-seq of human postmortem tissue identifies enrichment of mouse dissociation gene signatures in human microglia and astrocytes.
a, Experimental design schematic for snRNA-seq of all cell types from frozen postmortem brain tissue. b, UMAP plot of 47,505 nuclei analyzed via snRNA-seq from three postmortem subjects following LIGER analysis, colored by major cell type. c, Expression of canonical marker genes delineates major cell types. d, Visualization of the gene module scoring of the mouse DEG signature on human postmortem snRNA-seq dataset. e, Gene expression of exAM signature gene FOS across clusters. f–k, Plots of mouse activation score versus sample PMI (y axis) for each of the major CNS cell classes present in the dataset: f, microglia, g, astrocytes, h, oligodendrocytes, i, oligodendrocyte precursor cells, j, excitatory neurons, k, inhibitory neurons. f-k, Percentages denote number of nuclei above enrichment threshold denoted with gray dotted line; individual points are colored by donor.

