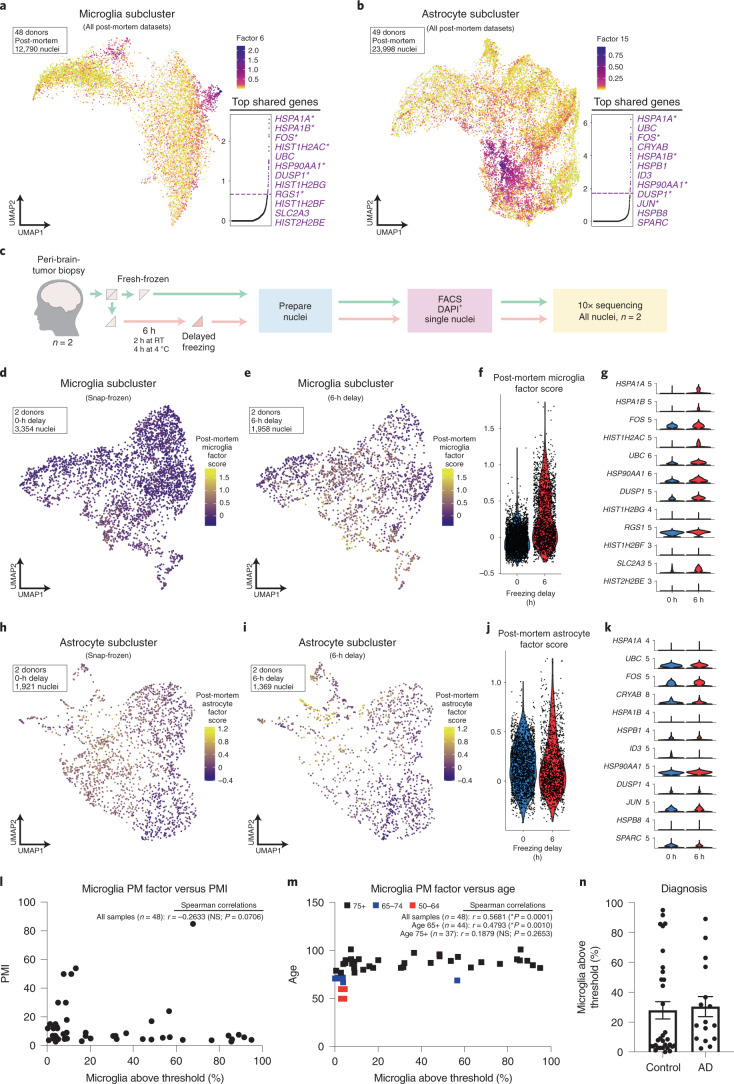
Fig. 4. LIGER analysis independently identifies similar gene expression signatures in postmortem data that are enriched in microglia following altered sample processing.
a, UMAP plot visualizing the enrichment of shared LIGER factor for 12,790 microglial nuclei from 48 samples across all postmortem datasets. b, UMAP plot visualizing the enrichment of shared LIGER factor for 23,998 astrocyte nuclei from 49 samples across all postmortem datasets. For both a and b, inset displays plot of normalized cell-specific factor loading scores across all genes in the dataset (dashed line indicates threshold cutoff for top genes for downstream analysis; Supplementary Table 22). Top loading genes, in order, are shown to the right of the inset plot. c, Experimental design schematic for experiment to analyze the effects of altered sample processing on gene expression. d–f, Visualization of gene module scoring results for score based on postmortem microglia factor, from a, in both snap-frozen (d) and 6-h delayed freezing (e) microglia nuclei on UMAP coordinates or via violin plot split by experimental group (f). g, Gene expression of top 12 loading genes in microglial factor from a split by experimental group (Supplementary Table 23 for DEG results). h–j, Visualization of gene module scoring results for score based on postmortem astrocyte factor, from b, in both snap-frozen (h) and 6-h delayed freezing (i) astrocyte nuclei on UMAP coordinates or via violin plot split by experimental group (j). k, Gene expression of top 12 loading genes in astrocyte factor from b split by experimental group (Supplementary Table 24 for DEG results). l,m, Spearman correlation of the percentage of microglia above score threshold for microglia factor score in each postmortem sample versus l, PMI and m, age of donor; graph annotations list Spearman r values and significance. n, Plot of percentage of microglia above score threshold for microglia factor score in each postmortem sample split by diagnosis; n = 48 independent samples from 5 studies/independent experiments (45 samples are from 4 previously published studies); n = 32 control/n = 16 Alzheimer’s disease. Data are presented as mean values ± s.e.m. AD, Alzheimer’s disease; NS, not significant; RT, room temperature.

