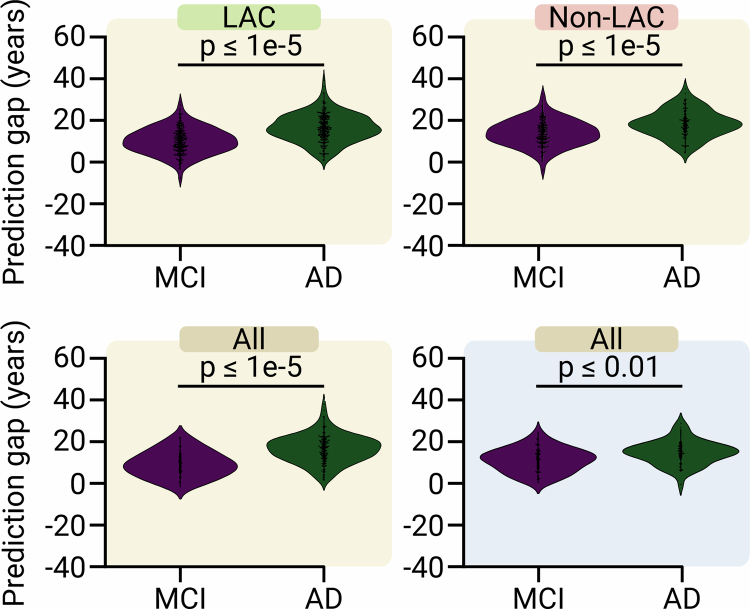
Extended Data Fig. 3. Brain-age gaps between subsamples of mild cognitive impairment (MCI) and Alzheimer’s disease (AD) groups matched by chronological age.
Results were similar to those reported for the total MCI (n fMRI = 256, n EEG = 52) and AD (n fMRI = 254, n EEG = 52) datasets in Fig. 4a,b (two-sided permutation test, without multiple comparisons, and with 5000 algorithm iterations). For fMRI LAC p < 1e-5, for fMRI non-LAC p < 1e-5, for fMRI all p < 1e-5, for EEG all p values = 0.0024. fMRI LAC violin plots (Mean, q1, q3, whisker low, whisker high, minima, maxima): MCI = (10.550, 6.216, 14.748, −3.166, 26.203, −7.616, 29.185) and AD = (16.796, 12.591, 21.568, 1.133, 33.756, 1.133, 39.751). fMRI non-LAC: MCI = (10.518, 6.216, 14.565, −3.166, 26.203, −7.616, 29.185) and AD = (15.006, 11.076, 18.222, 1.133, 26.726, 1.133, 31.797). fMRI LAC: MCI = (10.702, 6.565, 15.222, −0.325, 23.516, −0.325, 23.516) and AD = (18.057, 13.681, 22.218, 2.916, 33.756, 2.916, 39.751). EEG all MCI = (11.813, 7.739, 15.804, 1.153, 24.775, 1.153, 24.775) and AD = (15.341, 12.727, 18.343, 6.751, 26.207, 0.348, 28.932). FMRI = functional magnetic imaging, EEG = electroencephalography, LAC = Latin American and Caribbean countries, HC = healthy controls, MCI = mild cognitive impairm)ent, AD = Alzheimer’s disease, bvFTD = behavioral variant frontotemporal dementia.

