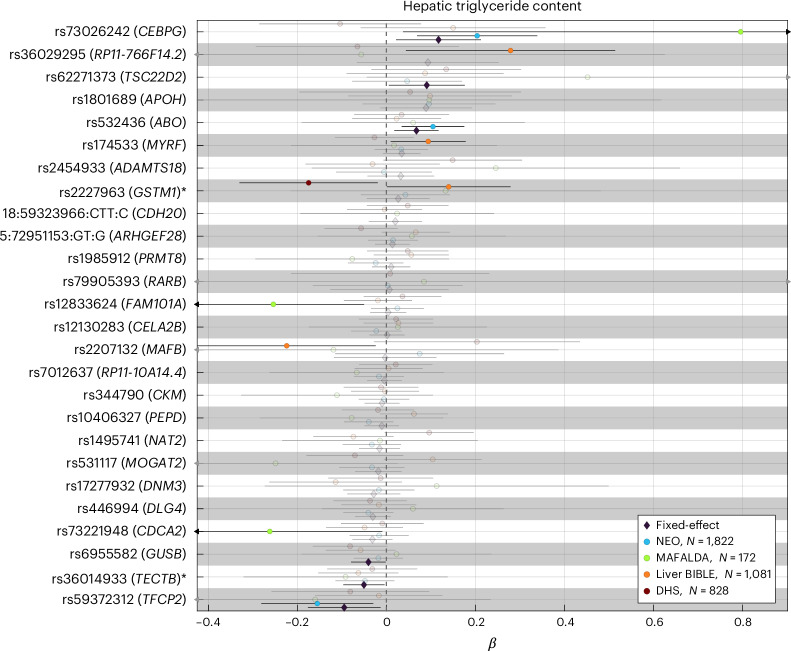
Fig. 2. The association between six previously unknown loci and hepatic triglyceride content in independent cohorts.
The association between each genetic variant and rank-based inverse normal transformed hepatic triglyceride content was performed using a linear regression analysis adjusted for age, sex, age2, age × sex, age2 × sex (shown as circles). Proxy variants were used for variants not available in the replication cohorts (r2 > 0.4 within a window of 1.5 Mb around each lead variant in the UK Biobank) as marked with an asterisk. Pooled effect estimates were calculated using inverse-variance-weighted fixed-effect meta-analysis (shown as diamonds). Genomic loci in bold are those with a P value <0.05 in the fixed-effects model. Error bars represent the 95% confidence intervals from the regression models or meta-analysis. Full summary statistics have been reported in Supplementary Table 14. P values are two-sided and not adjusted for multiple testing. NEO, Netherlands Epidemiology of Obesity study; DHS, Dallas Heart Study.

