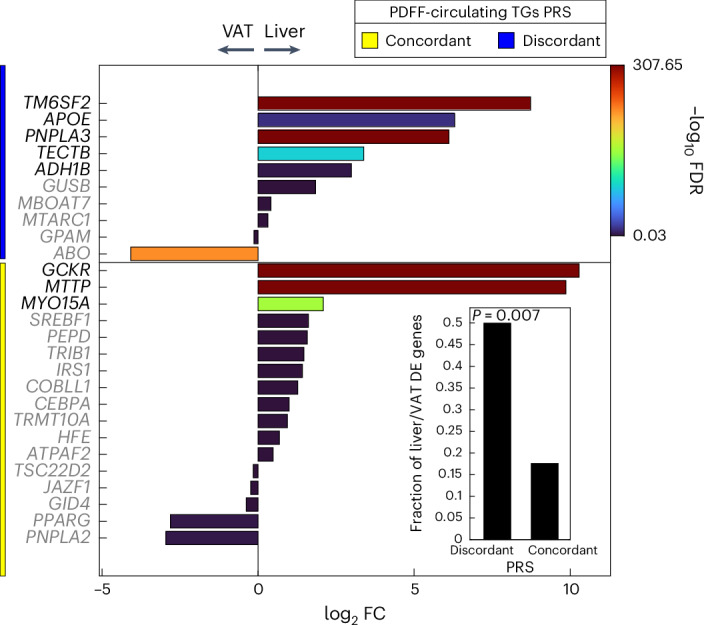
Fig. 4. mRNA expression of loci from the liver-specific (discordant) polygenic risk score is more abundant in the liver compared to the visceral adipose tissue.

Differential expression analysis of paired liver and VAT bulk RNA-seq data for mapped gene sets of concordant and discordant pPRS. The lower right bar plot shows the fraction of upregulated differentially expressed (DE) genes in the liver compared to VAT. The enrichment of pPRS with upregulated DE genes in the liver was calculated using one-sided Fisher’s exact test. FC, fold change.
