
Figure 1.
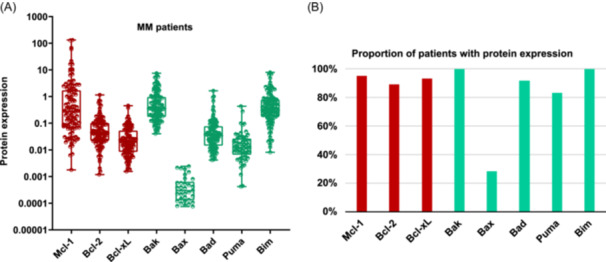
Bcl‐2 family protein expression in MM samples. (A) The expression of each protein was assessed by CNIA and normalized with respect to Gapdh expression in each case. (B) Percentage of patients with the presence of each protein. The antiapoptotic proteins (Mcl‐1, Bcl‐2, and Bcl‐xL) are represented in red, while the proapoptotic ones (Bak, Bax, Bad, Puma, and Bim) are shown in green. Only the patients with protein expression are shown.