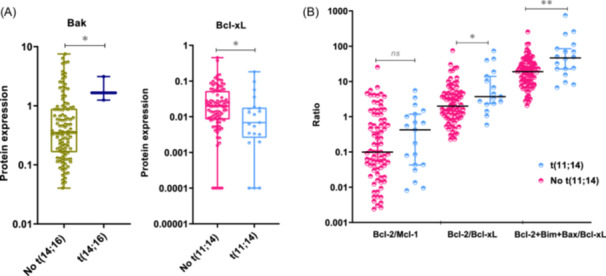
Figure 2.

Association between proteins and cytogenetic abnormalities. (A) Expression level of Bak‐1 and Bcl‐xL according to the presence of t(14;16) and t(11;14), respectively. (B) Expression level of the Bcl‐2/Mcl‐1, Bcl‐2/Bcl‐xL, and Bcl‐2+Bim+Bax/Bcl‐xL ratios, according to the presence or absence of t(11;14). The statistically significant differences between groups were determined by the Mann–Whitney U test. *p < 0.05; **p < 0.01: ns, non‐statistically significant.
