Figure 6.

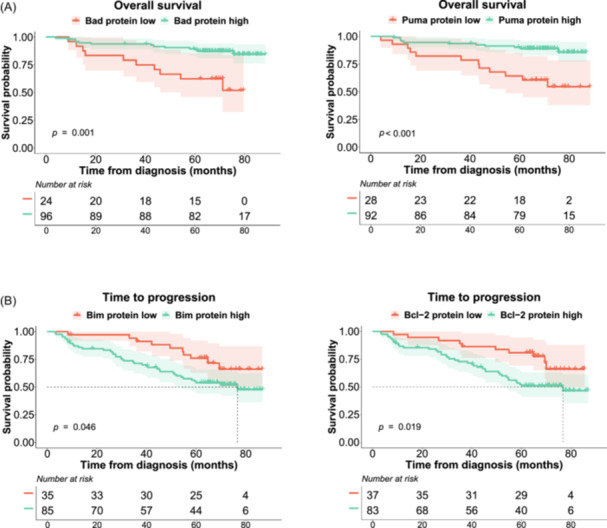
Kaplan–Meier curves for Bad, Puma, Bim, and Bcl‐2. Probability of overall survival (OS) (A) and survival without progression (time to progression [TTP]) (B) of MM patients by protein expression. The log‐rank test p values are shown.

Kaplan–Meier curves for Bad, Puma, Bim, and Bcl‐2. Probability of overall survival (OS) (A) and survival without progression (time to progression [TTP]) (B) of MM patients by protein expression. The log‐rank test p values are shown.