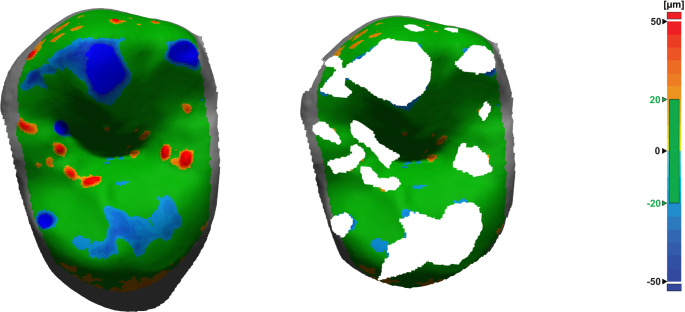
Fig. 3.
Surface deviations after initial alignment of baseline and recall situation (left). Reference surface used for final alignment after iterative removal of inaccuracies and areas of wear (right). Green areas lie within tolerance range of 20 μm; red: positive deviations correlating with impression errors, blue: negative deviations correlating with abrasion or model errors (e.g. fissures that flowed out differently or bubbles in gypsum model)

