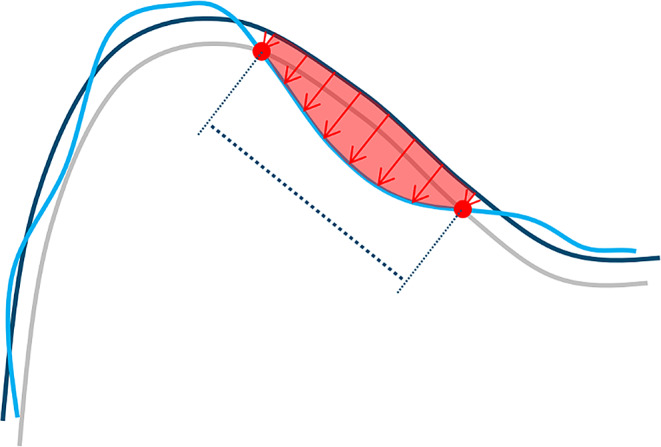
Fig. 5.

Two-dimensional scheme illustrating the wear measurement methodology: -30 μm offset (gray) of baseline surface (dark blue) shows clear intersection (red dots) with recall surface (light blue). Measurement direction for wear depth (red arrows) was defined by normal vector of best fitting plane to offset surface within respective ROI. Wear area projected into best-fitting plane of ROI (indicated by dotted line) was assessed. Wear volume (space between baseline and recall surface below ROI, indicated in red) can be calculated as product of mean vertical depth and wear area
