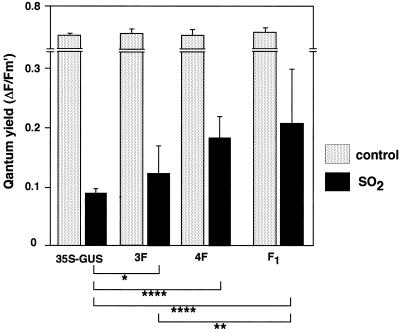
Figure 3.
Photosynthetic quantum yield of transgenic plants exposed to SO2. Six transgenic plants from each transgenic line were exposed to 1 μL L−1 SO2 for 3 h. The third leaves from the top of transgenic plants were assayed for quantum yield. The differences in the quantum yield among transgenic plants were statistically significant by Student's t test (*, P < 0.1; **, P < 0.05; ****, P < 0.005). Data are the means of analyses of six plants ± sd. 35S-GUS, Tobacco plants transformed with a bacterial UidA gene encoding GUS using as a negative control.

