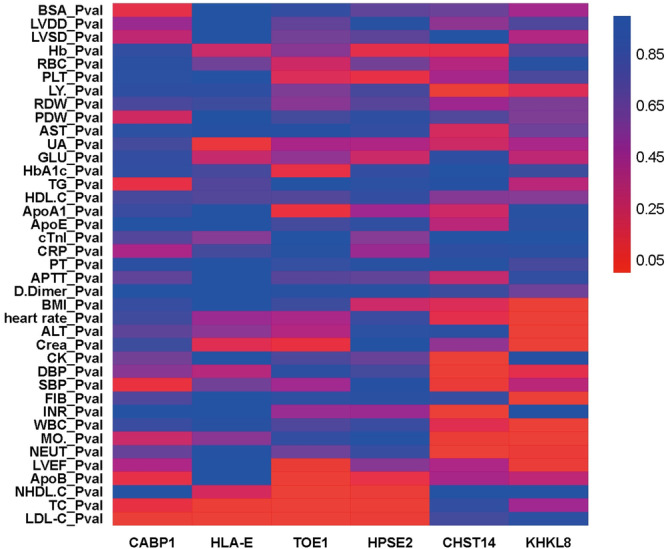
Figure 1.

Heatmap of CABP1, HLA‐E, TOE1, HPSE2, CHST14, and KHKL8 associated with clinical phenotypes. Data were shown as p values calculated by linear regression analysis. p < 0.05 was considered significant difference of certain phenotype between carriers of rare mutations in the candidate genes and noncarriers from the EOCAD group.
