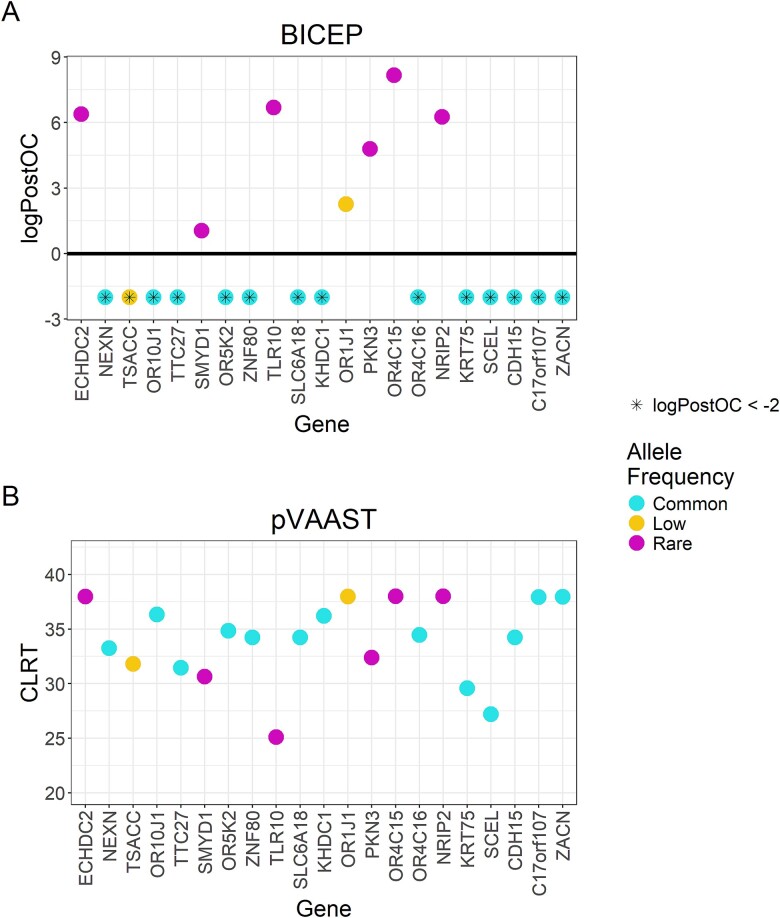
Figure 4.
BICEP and pVAAST applied to the CEPH 1463 pedigree with the synthetic phenotypes. Output scores for the pseudo-causal variants, including (A) the logPostOC from BICEP and (B) the gene-based composite likelihood ratio test score from pVAAST. For ease of presentation, the logPostOC scores were capped below at −2, indicated with an asterisk. Variants are coloured by their allele frequency (AF): Common (AF ≥ 5%), low frequency (1% ≤ AF < 5%), and rare (AF < 1%). Genes are ordered according to genomic position.

