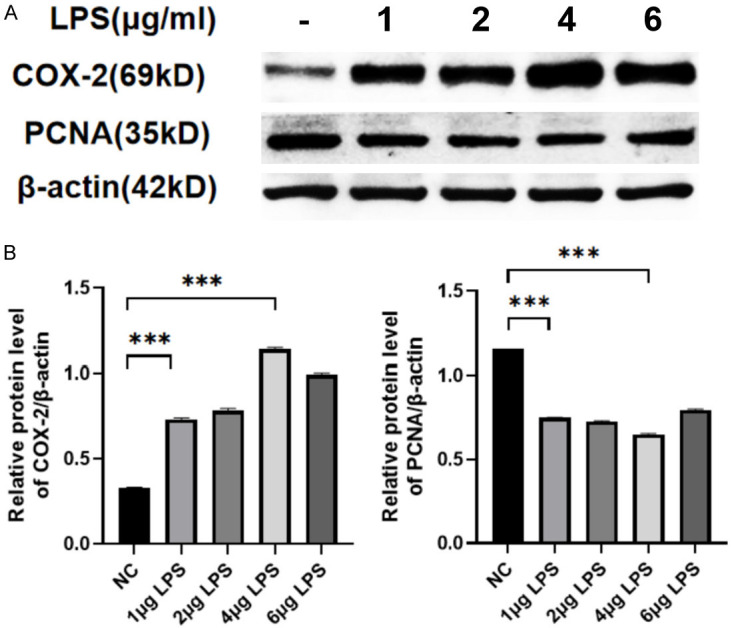
Figure 2.

LPS-induced cell inflammation model. A. Western blot analysis of COX-2 and PCNA expression at different concentrations of LPS. B. Relative protein level of COX-2 and PCNA. Data are presented as mean ± SD and analyzed by one-way ANOVA. ***P<0.001.
