
Figure 3.
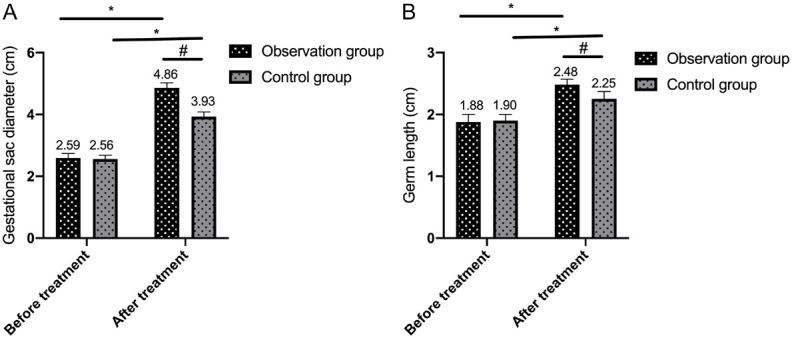
Comparison of gestational sac diameter and embryo length. A: Comparison of gestational sac diameter between the two groups before and after treatment; B: Comparison of embryo length between the two groups before and after treatment. Note: * denotes P<0.05 in the intra-group comparison before and after treatment; # denotes P<0.05 in the inter-group comparison after treatment.