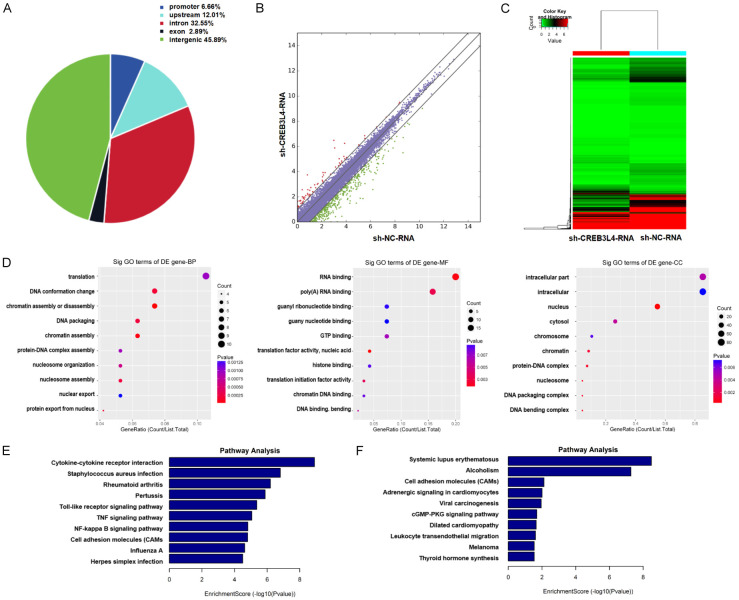
Figure 3.
Gene Ontology (GO) and Kyoto Encyclopedia of Genes and Genome (KEGG) analysis results from chromatin immunoprecipitation assay sequencing and mRNA sequencing. A. Distribution of enriched peaks across genomic features in the sh-CREB3L4-chip vs. sh-NC-chip group; B. Scatter plot showing differentially expressed genes in the sh-CREB3L4-RNA vs. sh-NC-RNA group; C. Heatmap illustrating differentially expressed genes in the sh-CREB3L4-RNA vs. sh-NC-RNA group; D. Top ten GeneRatio-related genes in biological processes (BP), molecular functions (MF), and cellular components (CC) in the downregulated sh-CREB3L4-chip vs. sh-NC-chip group; E. Signaling pathways associated with the top ten enrichment score-related genes in the downregulated sh-CREB3L4-RNA vs. sh-NC-RNA group; F. Signaling pathways associated with the top ten enrichment score-related genes in the upregulated sh-CREB3L4-RNA_vs_sh-NC-RNA. sh-CREB3L4: CREB3L4 knockdown group. sh-NC: Knockdown control group.

