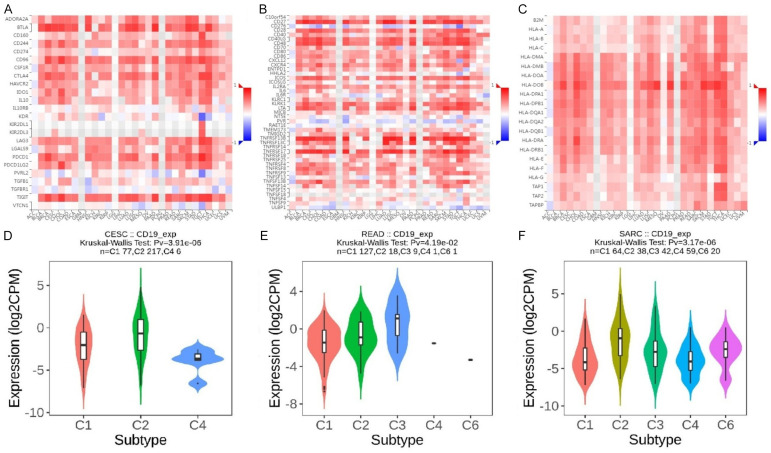
Figure 5.
Correlation of CD19 expression with immune regulators and subtypes across different cancer types. A. This panel displays the correlation of CD19 with immune inhibitor genes. B. This panel shows the correlation of CD19 with immune stimulator genes. C. This panel illustrates the correlation of CD19 with MHC (Major Histocompatibility Complex) genes. The color scale again indicates the strength and direction of the correlation. D. This panel represents the expression of CD19 in in cervical squamous cell carcinoma (CESC) across different immune subtypes (C1, C2, and C4). E. This panel shows CD19 expression rectum adenocarcinoma (READ) across subtypes C1, C2, C3, C4, and C6. F. This panel illustrates CD19 expression in sarcoma (SARC) across subtypes C1, C2, C3, C4, and C6. P-value < 0.05.

