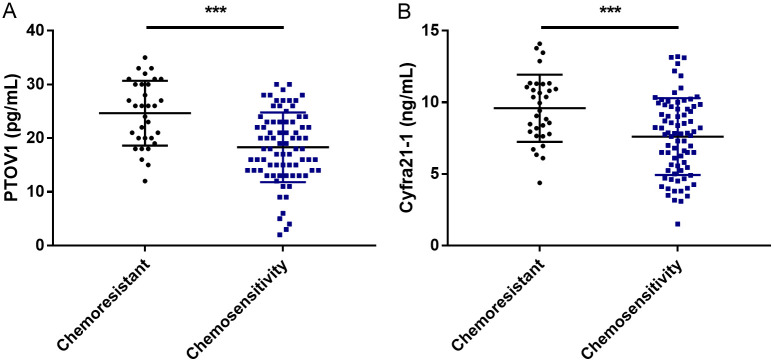
Figure 1.
Comparison of PTOV1 and Cyfra21-1 levels between the chemoresistant and chemosensitive groups. A. PTOV1 in the chemoresistant and chemosensitive groups. B. Cyfra21-1 in the chemoresistant and chemosensitive groups. Note: ***P<0.001. PTOV1, prostate tumor overexpressed 1; Cyfra21-1, cytokeratin 19 fragment.

