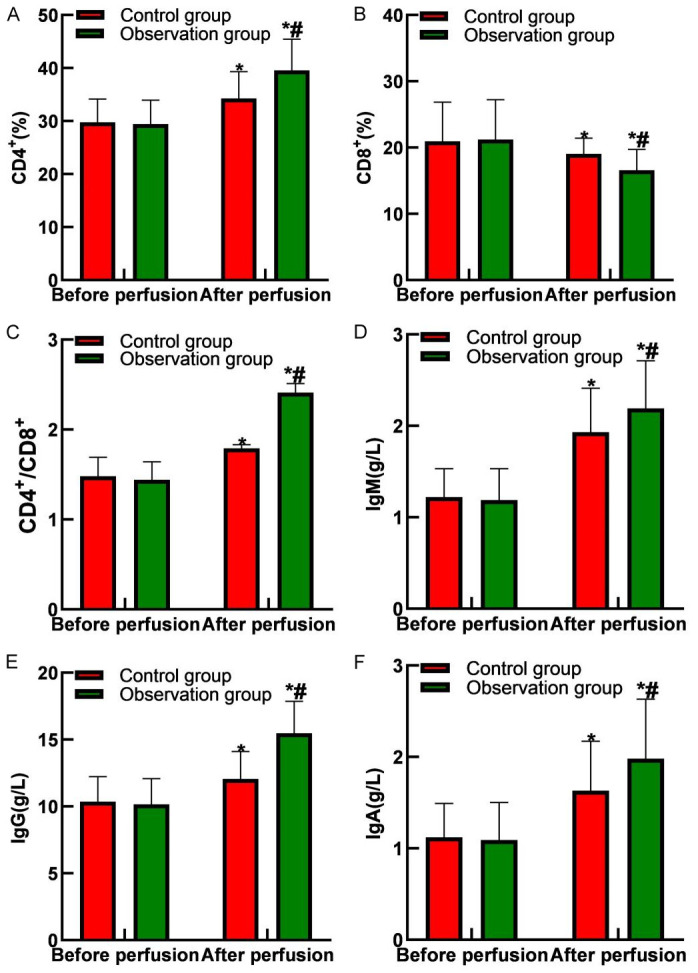
Figure 4.

Comparison of immune function between the two groups. A. CD4+ levels; B. CD8+ levels; C. CD4+/CD8+ levels; D. IgM levels; E. IgG levels; F. IgA levels. Note: Compared with before perfusion, *P<0.05; compared with the control group, #P<0.05. IgM: Immunoglobulin M, IgG: Immunoglobulin G, IgA: Immunoglobulin A.
