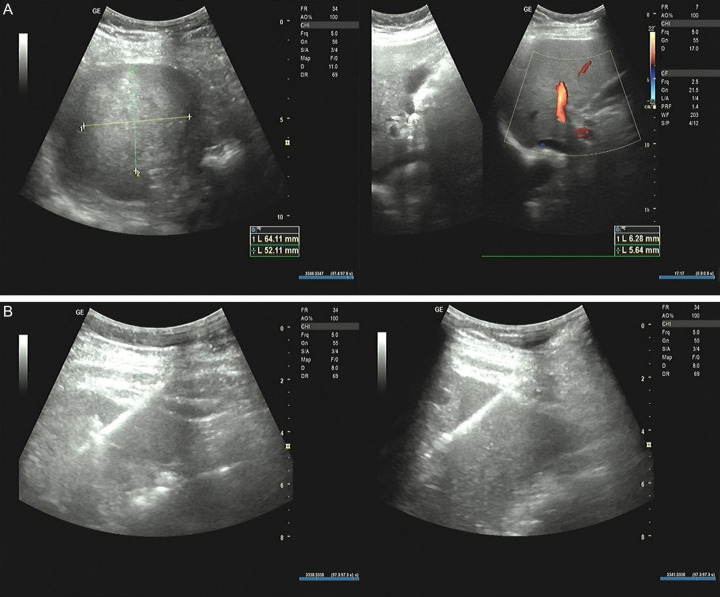
Figure 2.
Liver biopsy case diagram. A. To measure the size of the tumor: a mixed mass was detected in the parenchyma of the right lobe of the liver, the size was about 64×52 mm, the boundary was not clear, and the color blood flow signal could be seen around it. B. Puncture process: under the guidance of real-time B ultrasound, the automatic biopsy gun was used to eject the inner groove cutting needle, and the solid echo mass of the right lobe of the liver was punctured and biopsied four times.

