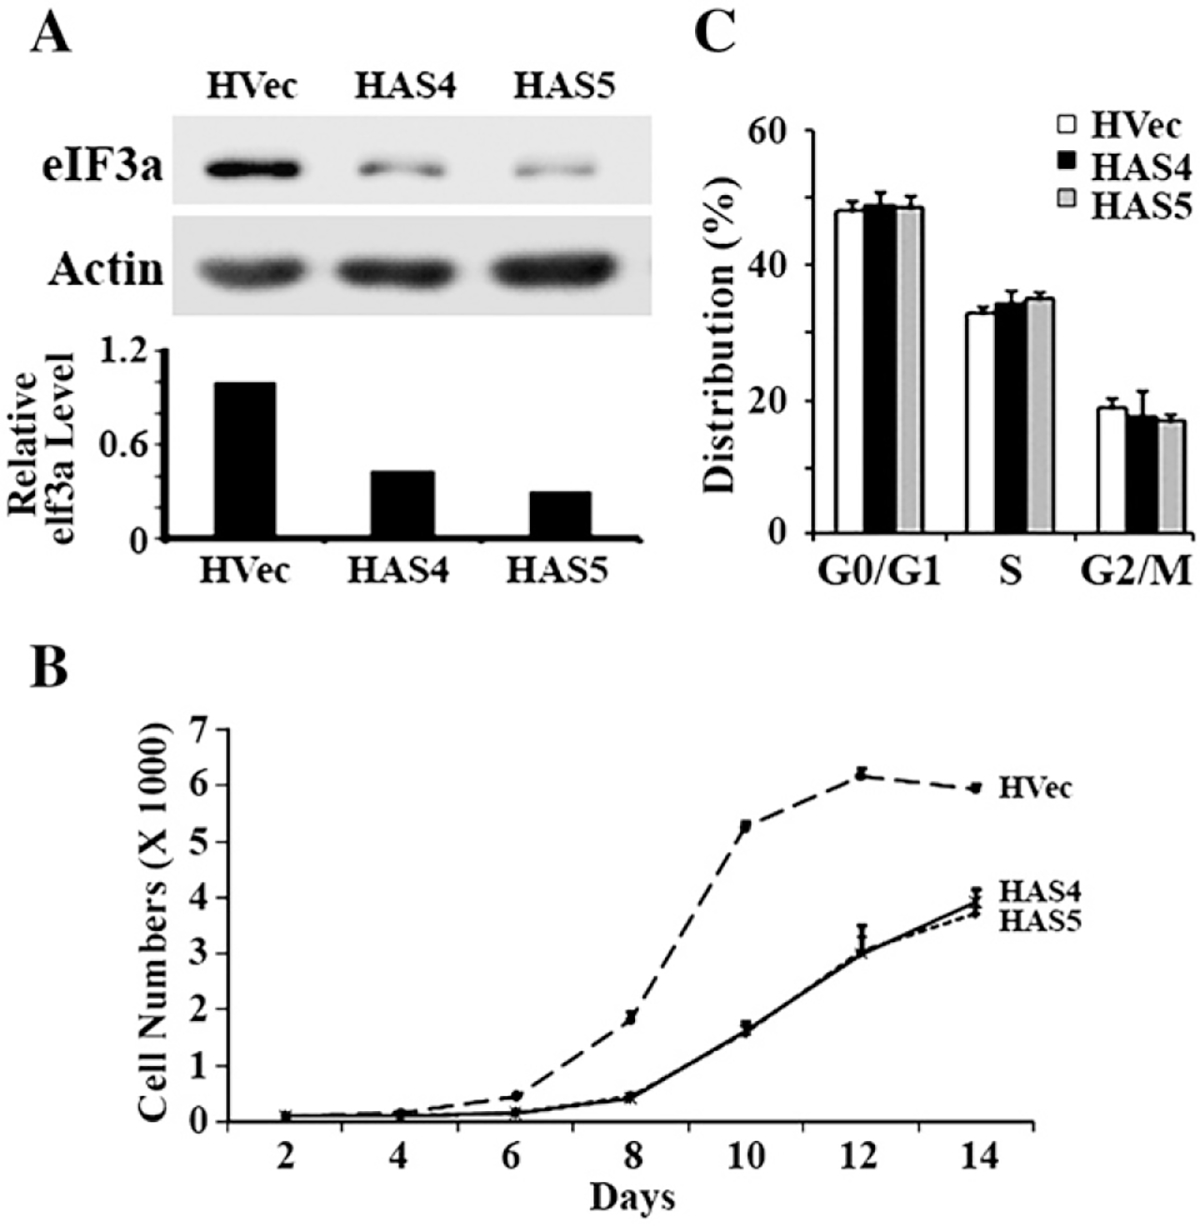
Fig. 5 –

The effect of reducing eIF3a expression on cell cycle distribution. Two stable H1299 cell clones transfected with antisense cDNA of eIF3a (HAS4 and HAS5) together with vector-transfected clones (HVec) were used to test the expression level of eIF3a using western blot analysis with actin as a loading control (A), growth rate (B), and cell cycle distribution (C) using methods as described in Materials and methods.
