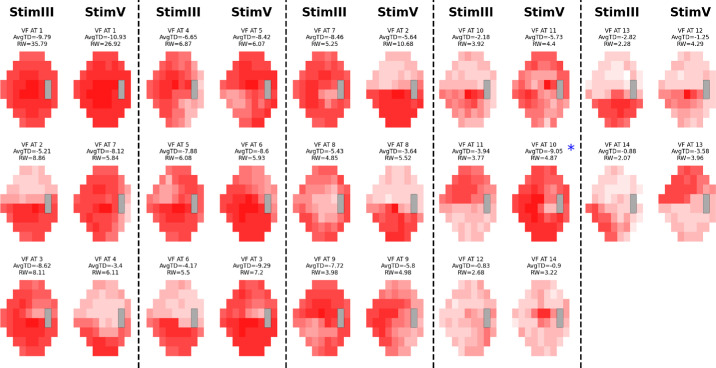
Figure 3.
NAION AT stimulus comparison map. VF patterns in NAION using stimulus sizes III and V, displayed side by side. The different shades of red within each AT represent TD values. Size III patterns are on the left, with the most closely matching size V patterns on the right. There is a near 1:1 pattern similarity for corresponding ATs except between size III AT12 and size V AT14 and size III AT14 and size V AT9.

