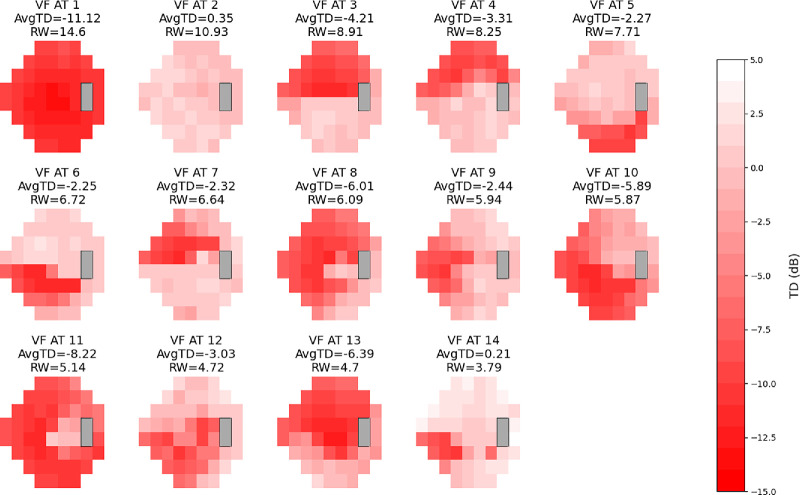
Figure 4.
Combined stimulus glaucoma AT map. Combined VF patterns in glaucoma using both stimulus size III and V. The different shades of red within each AT represent TD values, with the scale on the right indicating the corresponding values for each shade. The color scales range from −15 dB to 5 dB. Each AT is displayed with its average TD value and RW as a percentage within the combined dataset. ATs are numbered and presented in order of RW, mirroring integration of patterns from both stimuli.

