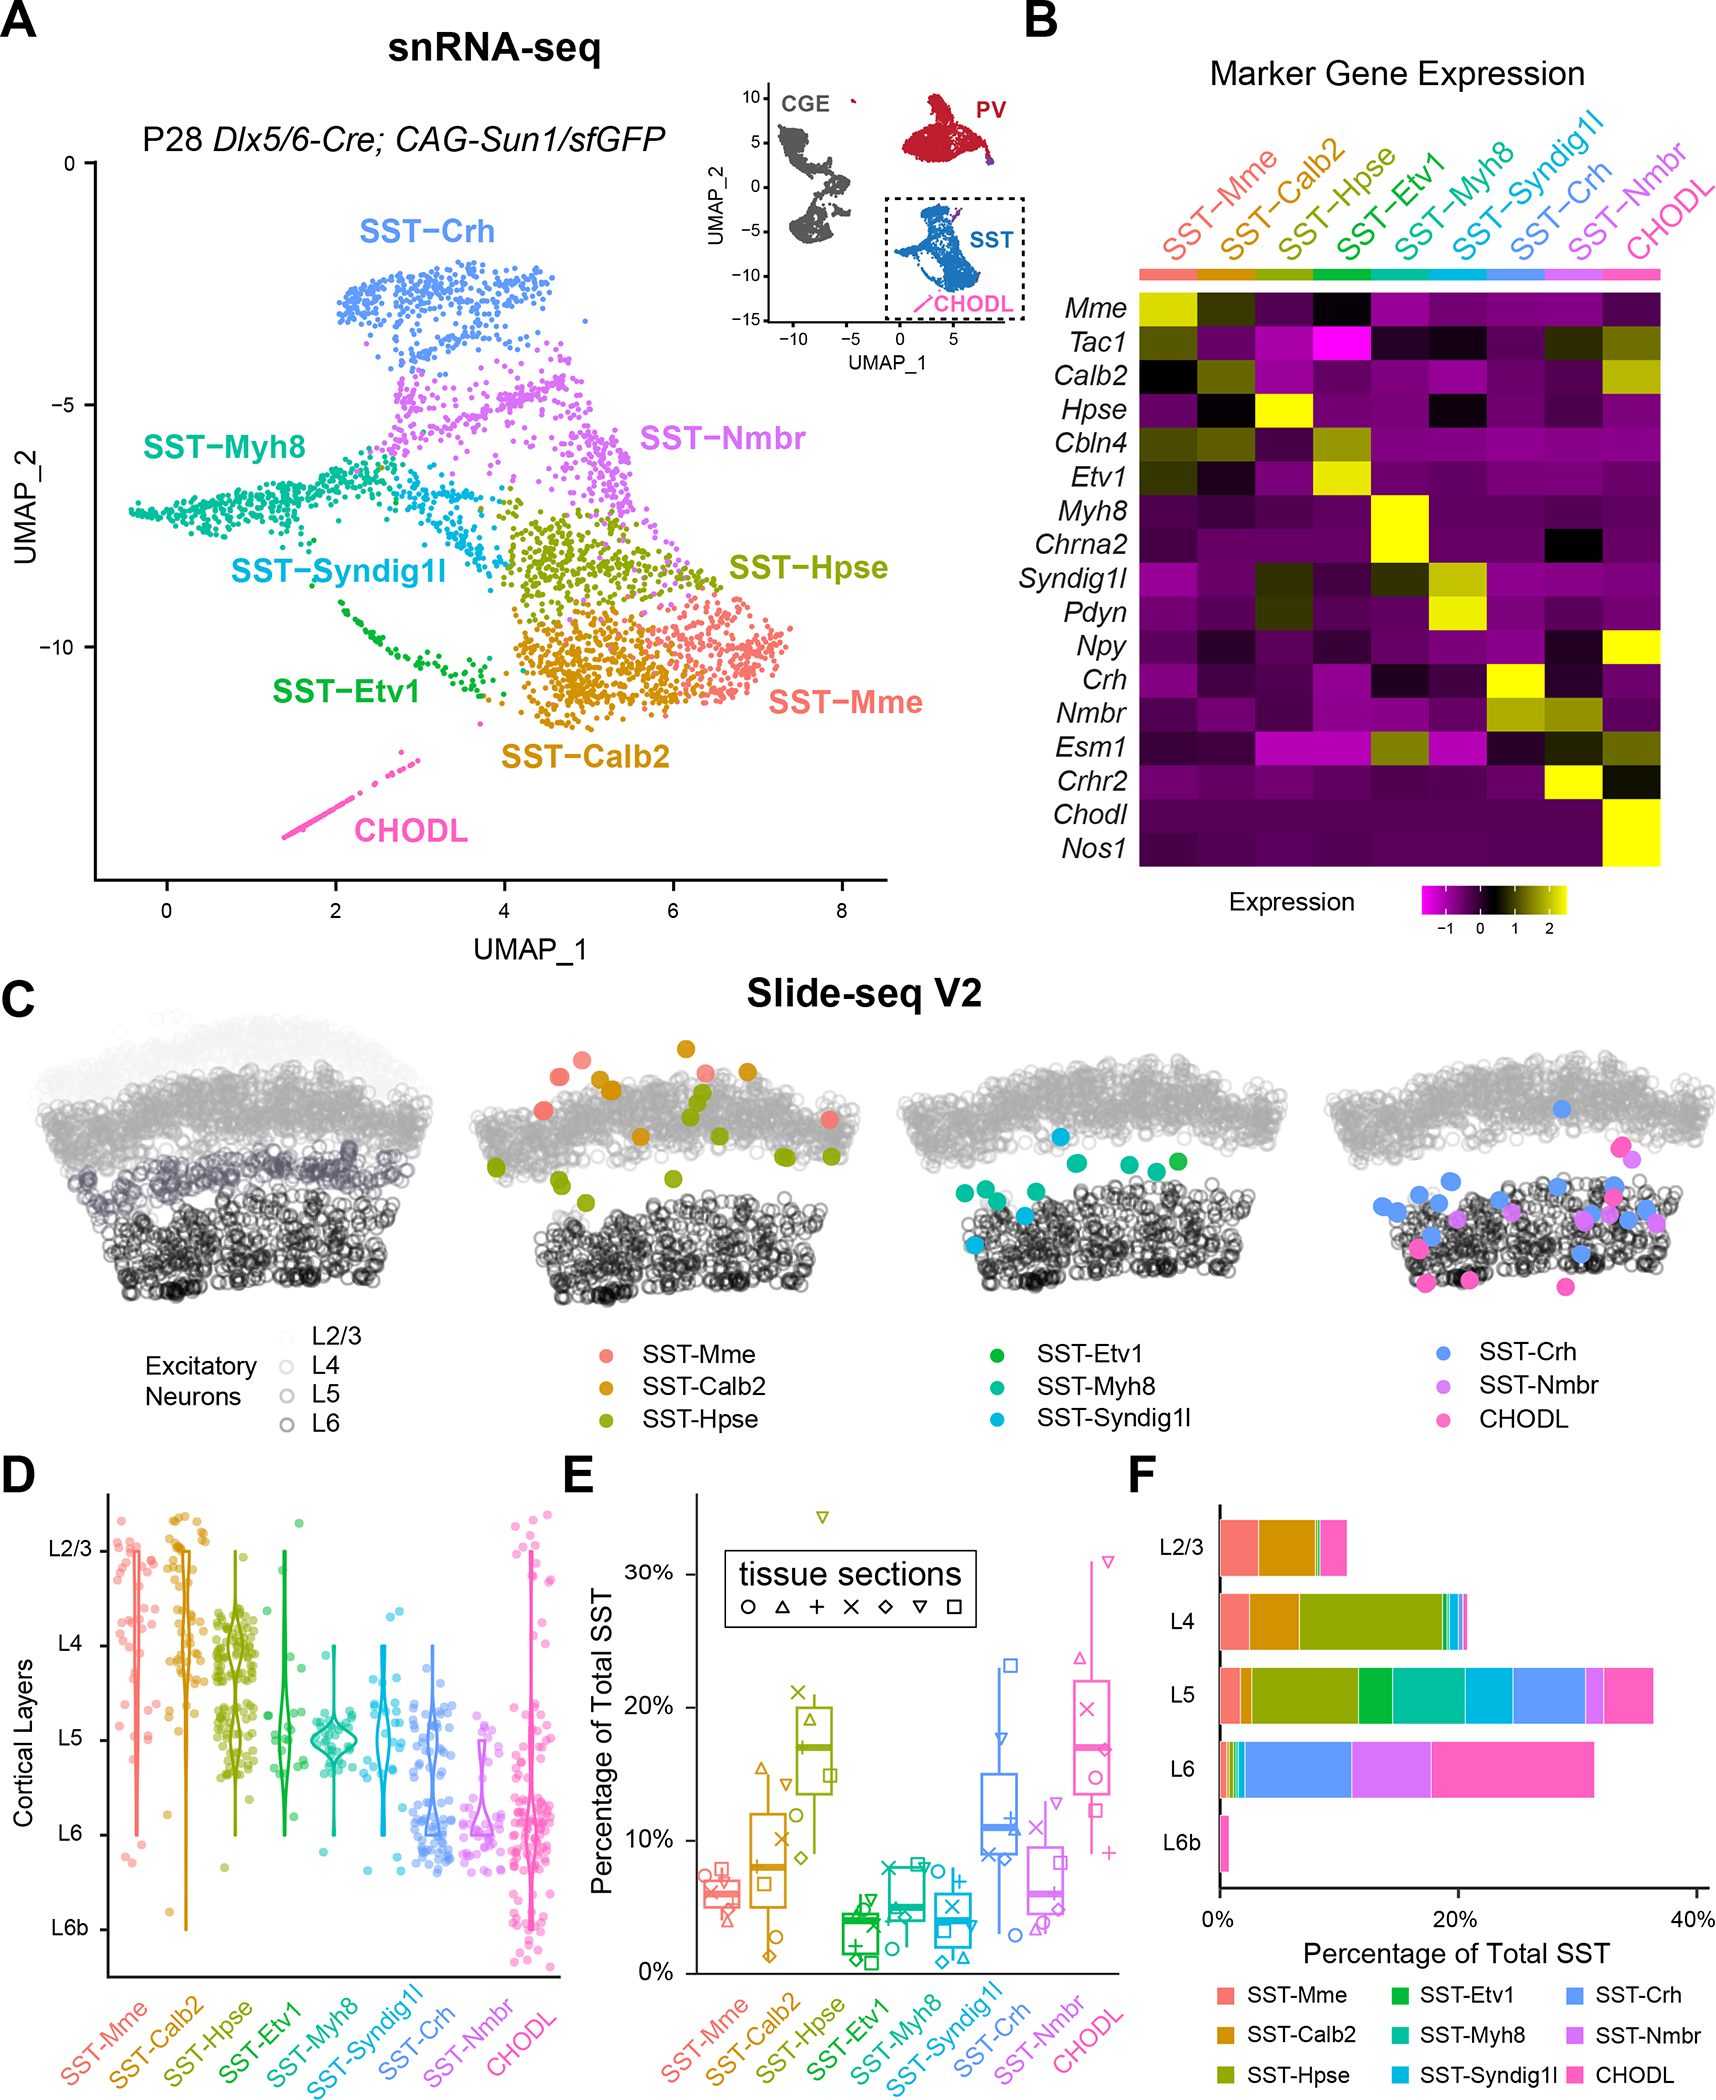
Figure 1. Spatial transcriptomic analysis reveals the laminar organization of eight SST interneuron subtypes.

(A) UMAP visualization of snRNA-seq of P28 cortical interneurons22, illustrating eight SST subtypes and the CHODL subtype. Inset showing the UMAP of the entire dataset. CGE, caudal ganglionic eminence.
(B) Heatmap showing the scaled expression of marker genes for each SST subtype based on snRNA-seq data.
(C) Robust cell type decomposition (RCTD) assignment of spatial clusters to different SST subtypes on a representative Slide-seq V2 experiment based on a scRNA-seq reference (see Methods). Gray circles represent the location of excitatory neurons in different layers for reference.
(D) Violin plots demonstrate the laminar distribution of different SST subtypes identified in Slide-seqV2 experiments (n = 7 tissue sections, 4 mice).
(E) Boxplot showing the proportion of different SST subtypes out of 525 total SST interneurons identified.
(F) Bar plot showing the proportion of different SST subtypes identified across different cortical layers.
See also Figures S1–2, Tables S1–2.
