
Figure 3. Laminar positioning correlates with SST subtype innervation.
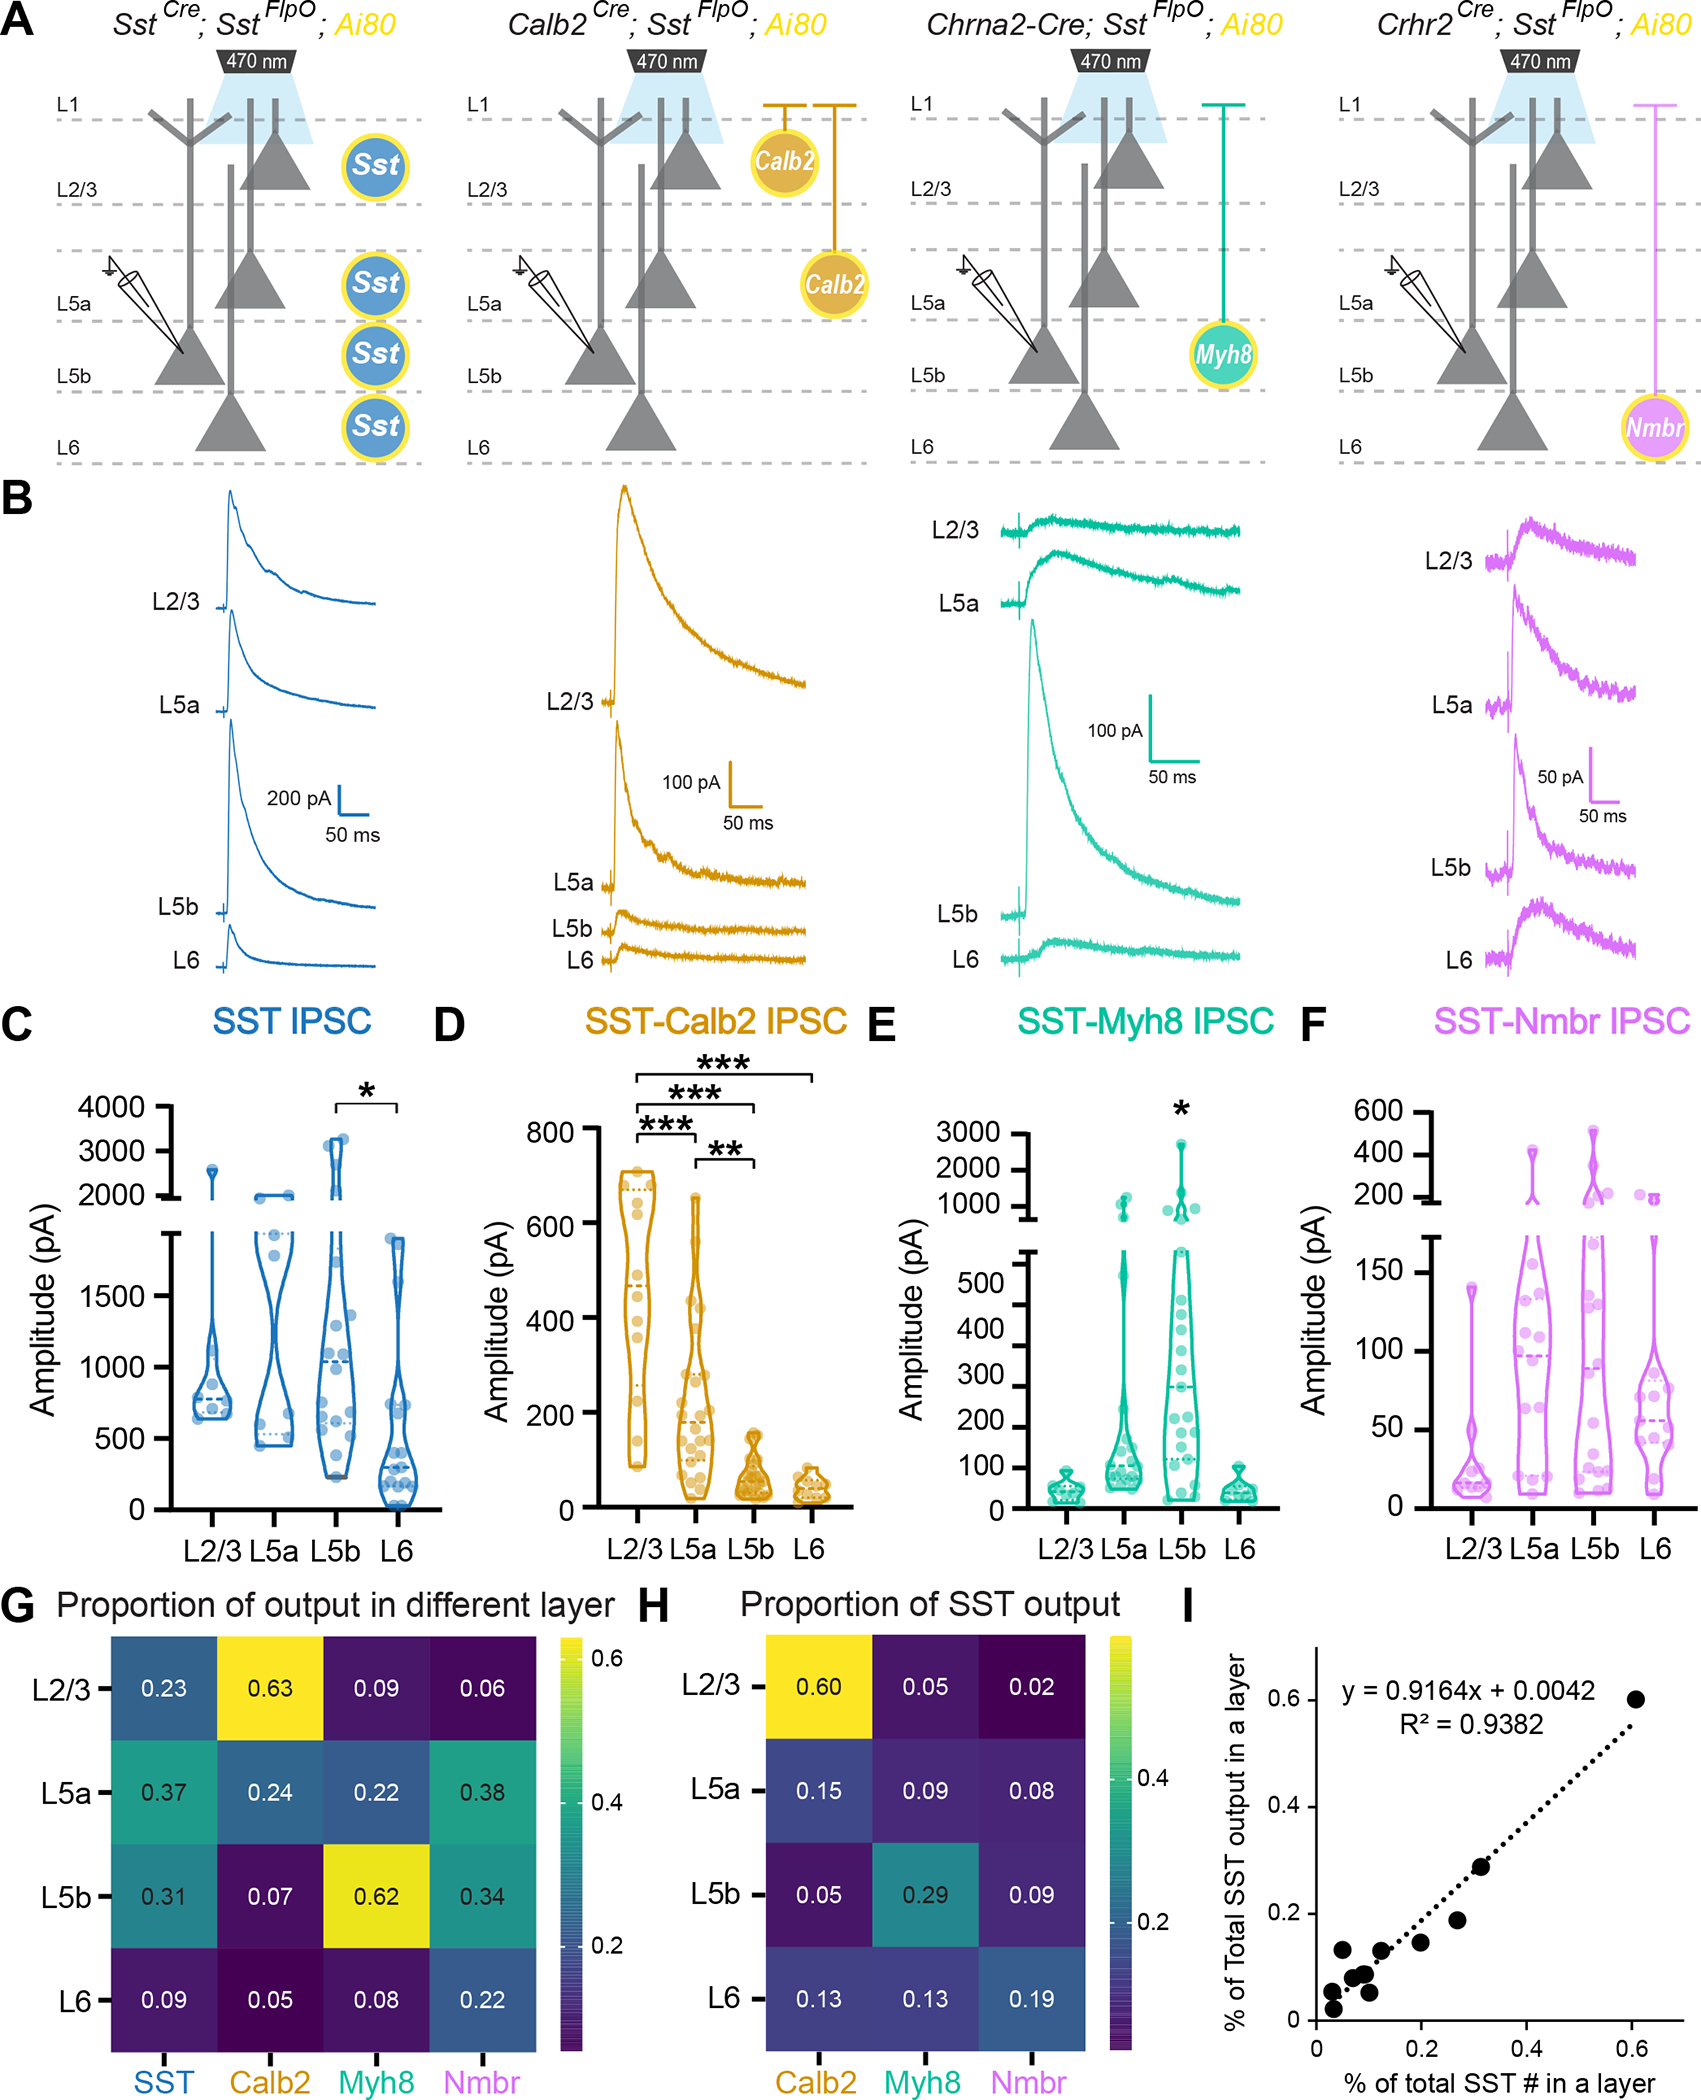
(A) Recording scheme. Pan-SST interneurons or three SST subtypes, SST-Calb2, SST-Myh8, SST-Nmbr, were genetically targeted to express CatCh by crossing with the Ai80 reporter line. Postsynaptic IPSCs were recorded from pyramidal neurons across layers in response to 1 ms light stimulation.
(B) Example average traces from pyramidal neurons across layers in response to pan-SST stimulation (left) and individual SST subtypes (three right panels).
(C-F) Violin plot of the evoked IPSC amplitude upon stimulation of pan-SST interneurons or SST-Calb2, SST-Myh8, SST-Nmbr interneurons.
(G) Heatmap of the ratio of median evoked IPSC amplitude for pan-SST interneurons or for individual SST subtypes across layers. Data were normalized across columns, where the value represents the ratio between the median evoked IPSC amplitude in a particular layer compared to the summed median IPSC amplitude of that SST subtype across layers.
(H) Heatmap of the proportion of inhibition from individual SST subtype as compared to the inhibition from pan-SST interneurons in different layers.
(I) Plot showing that percentage of individual SST subtype out of the total number of SST interneurons found in a particular layer (x-axis) is correlated with the proportion of the inhibitory output by individual SST subtype out of pan-SST interneuron response in that layer (y-axis).