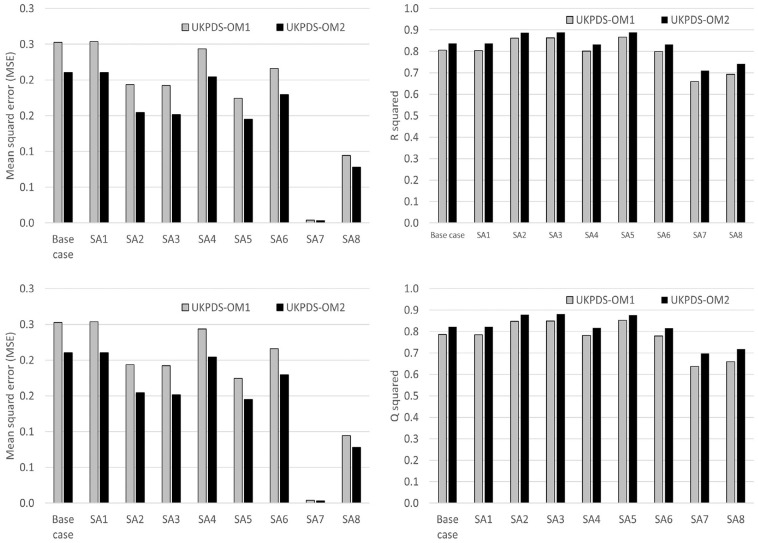
Figure 2.
MSE, MAE, Q2, and R2 for QALYs.
IHD, ischemic heart disease; MAE, mean absolute error; MI, myocardial infarction; MSE, mean squared error; Q2 = 1 − MSE/standard deviation 2 ; QALY, quality-adjusted life-year; SA, sensitivity analysis; UKPDS-OM1, United Kingdom Prospective Diabetes Study Outcomes Model version 1; UKPDS-OM2, United Kingdom Prospective Diabetes Study Outcomes Model version 2.
SA1: Trial QALYs include second MI, stroke, amputation, blindness, and ulcer since randomization regardless of patient history.
SA2: Excluding disutility from second MI, stroke, or amputation in UKPDS-OM2: 8,269 patients with no prior MI, stroke, or amputation.
SA3: Excluding ulcer and second events from UKPDS-OM2 (which are not captured in UKPDS-OM1): 8,269 patients with no prior MI, stroke, or amputation.
SA4: Alternative utility values for both UKPDS-OM1 and UKPDS-OM2: initial utility, 0.785; IHD, −0.09; MI, −0.055; stroke, −0.164; heart failure, −0.108; blindness, −0.074; ulcer, −0.170; amputation, −0.280; renal failure, −0.204; disutility for subsequent years same as year of event. 32
SA5: Excluding QALYs in the year when patients were censored for both trial and model QALYs.
SA6: Discounting QALYs at 3.5% per annum.
SA7: 1-y time horizon.
SA8: 3-y time horizon.

