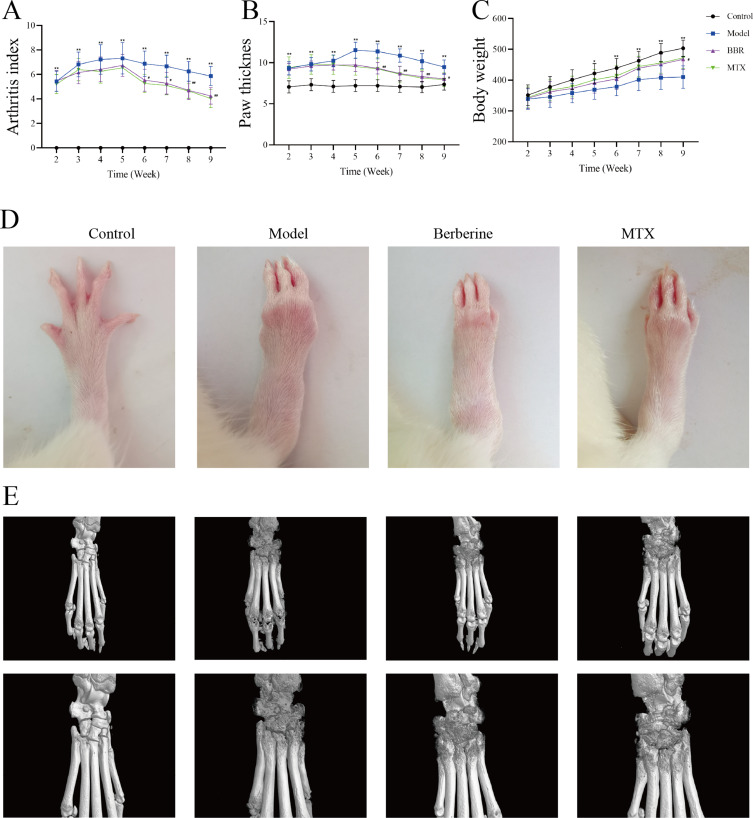
Figure 2.
(A) The arthritis index of rats. (B) The paw thickness of rats. (C) The body weight changes of rats. Data were expressed as mean ± SD. *p < 0.05, **p < 0.01, compared with Control; #p < 0.05, ##p < 0.001 compared with Model. (D) The represented paw of rat in different treatment groups. (E) Represented image of Micro-CT analysis of joint destructions of rats.

