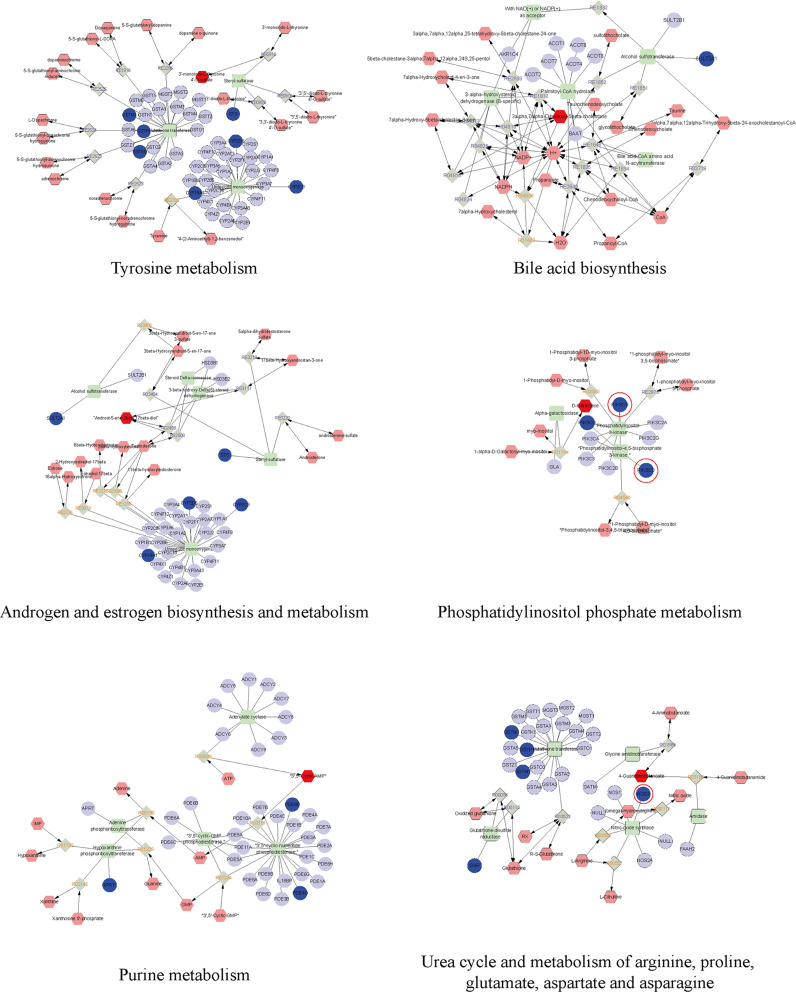
Figure 6.
The drug-reaction-enzyme-gene network networks of the key metabolites and targets. The red hexagons, grey diamonds, green round rectangle and blue circles represent the active drug, reactions, enzyme and genes, respectively. Key metabolites, proteins and genes were darkened. PIK3-AKT pathway relevant genes are circled in red.

