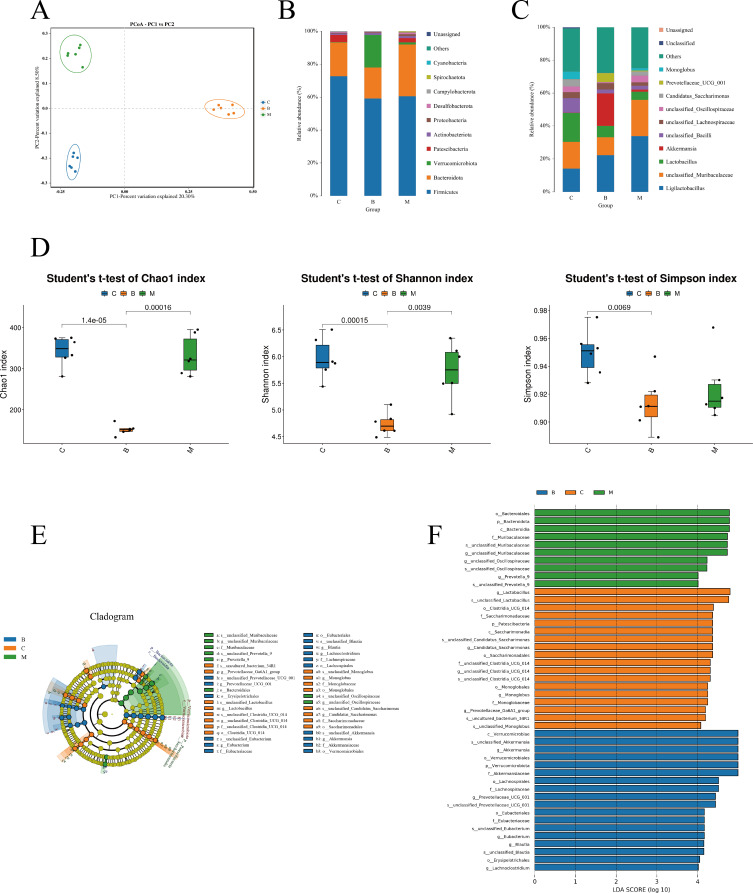
Figure 9.
(A) Beta diversity of the gut microbiota was assessed by principal coordinate analyses (PCoA). (B) The relative abundance of bacteria at the phylum level. (C) The relative abundance of bacteria at the genus level. (D)Alpha diversity indices including Chao1, Shannon and Simpson. (E) LEfSe classification evolutionary tree. (F) LEfSe linear discriminant analysis (LDA) score.

