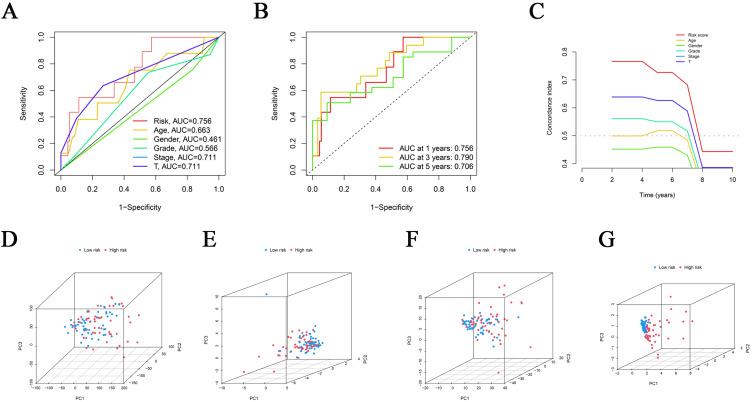
Figure 2.
Receiver operating characteristic curves (ROC), C-index and Principal Component Analysis (PCA). (A) Predictive accuracy of the risk model compared with clinicopathologic characteristics such as age, gender, stage and T; (B) Accuracy of the risk characteristic based on a whole-group prediction of 1-, 3-, and 5-years receiver operating characteristic curves. (C) C-index curve of the risk model. PCA plots depicted the distribution of samples based on the all genes of the prognostic signature (D), cuproptosis-related genes (E), cuproptosis-related lncRNAs (F), and the expression of three lncRNAs of the prognostic signature (G).

