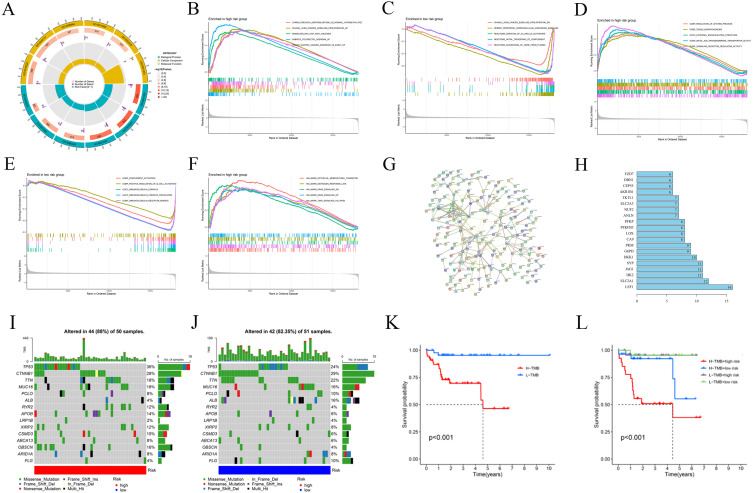
Figure 4.
Gene Ontology (GO) analysis, gene set enrichment analysis (GSEA), protein-protein interaction (PPI) network and Tumor mutation burden (TMB). (A) Gene Ontology (GO) analysis demonstrated the richness of molecular biological processes (BP), cellular components (CC), and molecular functions (MF). (B-F) GSEA revealed significant differences in the enrichment of c2.all.v2022.1.Hs.symbols.gmt, c5.all.v2022.1.Hs.symbols.gmt, and h.all.v2022.1.Hs.symbols.gmt in the TCGA HBV-HCC cohort. (G) PPI network of risk differentially expressed genes (DEGs). (H) Information about nodes in the PPI network. Tumor mutation burden (TMB) in the TCGA HBV-HCC cohort. Waterfall plots of somatic mutation characteristics in the two groups (I and J). K–M survival curves between the high- and low-TMB groups (K); K–M survival curves between the four groups (L).

