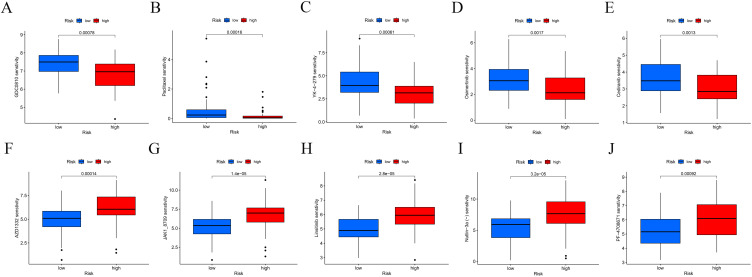
Figure 5.
Drug sensitivity analysis of low- and high-risk groups. The distribution of the half maximal inhibitory concentration (IC50) showed a significant difference of patients in the low- and high- risk groups among (A) GDC0810, (B) Paclitaxel, (C) YK-4-279, (D) Osimertinib, (E) Cediranib, (F)AZD1332, (G) JAK1_8709, (H) Linsitinib, (I) Nutlin-3a (-), and (J) PF-4708671.

