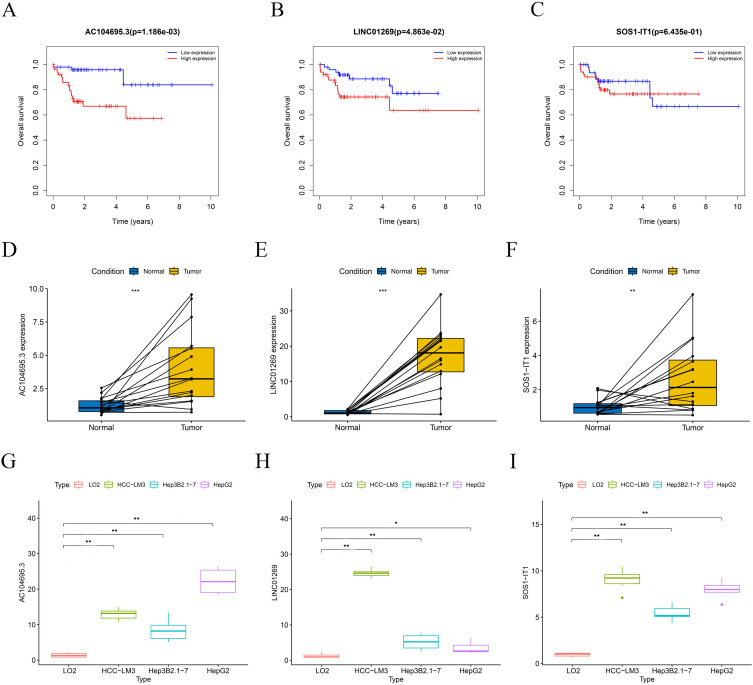
Figure 7.
Hub cuproptosis-related lncRNA (CRLR) survival analysis in the model. K–M survival curves between the high- and low-expression groups of lncRNA AC104695.3 (A), LINC01269 (B) and lncRNA SOS1-IT1 (C). Validation of prognostic LncRNAs in the 3- CRLRs model in clinical HCC tumor samples (D - F). Expression levels of AC104695.3 (D), LINC01269 (E) and SOS1-IT1(F) in HCC cell lines HepG2, Hep3B2.1–7, HCC-LM3, and normal liver cell LO2(G - I). Significant differences are indicated by *P < 0.05, **P < 0.01, and ***P < 0.001.

