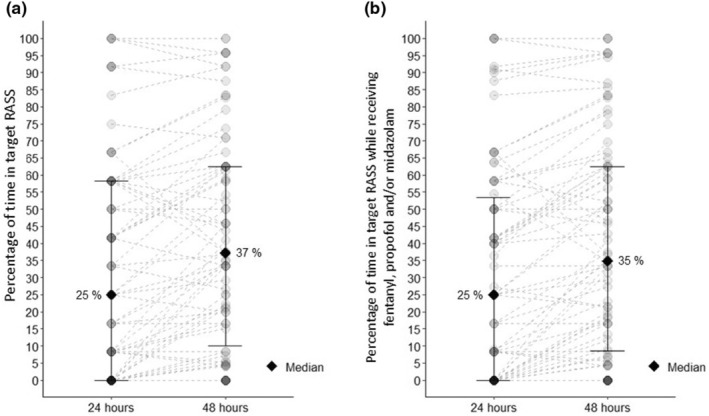
FIGURE 1.

Percentage of time within the target RASS range in the first 24 and 48 h for each participant. Each point represents a patient, the solid diamond represents median, and bars represent 25 and 75 percentiles. The dashed line between the points at 24 and 48 h represents the change in RASS over time. For each participant, a percentage of time within the target RASS range was calculated for the first 24 and 48 h by dividing the number of measurements within the target range by the number of all available measurements then multiplied by 100. Plot a: represents the percentage of time in the target RASS range (0 to −2) including all RASS measurements and Plot b: represents the percentage of time in the target RASS range (0 to −2) including all RASS measurements when patients were administered fentanyl, propofol, and/or midazolam. RASS, Richmond Agitation‐Sedation Scale.
