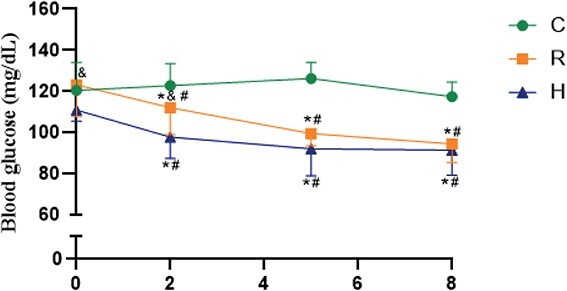
Figure 2.

Blood glucose at 0 (basal) and the ends of 2, 5, and 8 wk of the experiment. C: Control group; R: Caloric restriction (30%) group; and H: Caloric restriction (30%) + high-protein (40%) group diets. * means difference in comparison to C, p < .05. # means difference in comparison to basal time, p < .05.
