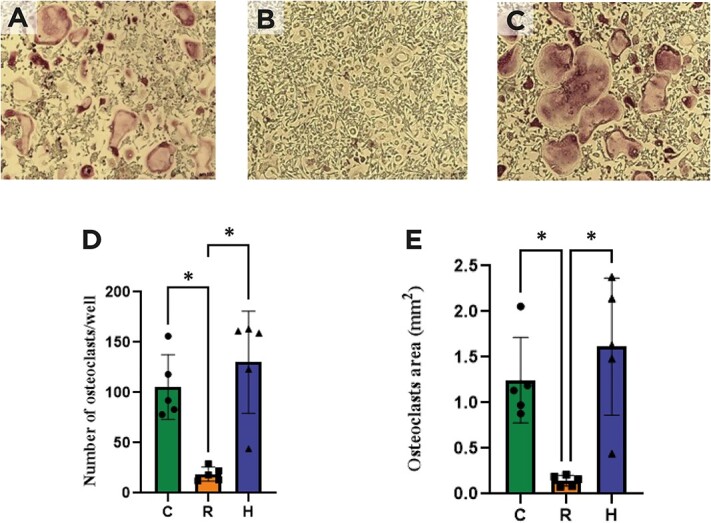
Figure 6.

Osteoclast (OC) differentiation identified by TRAP staining. (A) Control, (B) caloric restriction (30%) (C) caloric restriction (30%) + high-protein (40%) groups, (D) number of osteoclasts per well, (E) osteoclasts area (mm2). * means p < .05.
